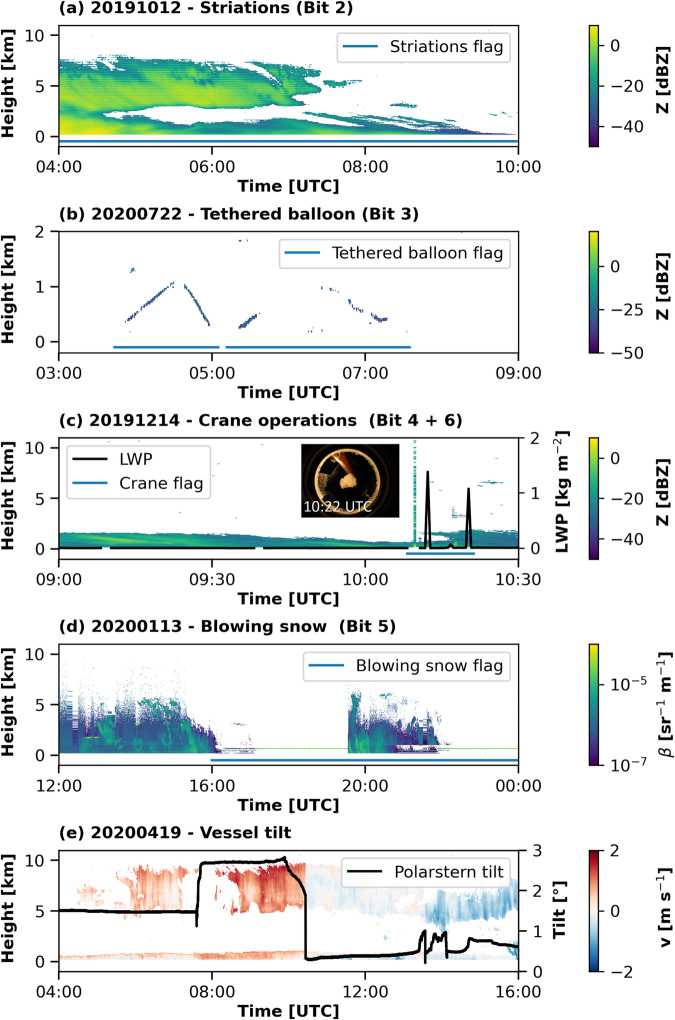
Fig. 9.
Examples for some of the issues identified during the processing of the MOSAiC Cloudnet dataset. Panel (a) shows the striations in the cloud radar observations. In panel (b) artifacts in the cloud radar reflectivity caused by two tethered balloon flights are depicted. Artifacts in the cloud radar reflectivity and LWP (black line) caused by crane operations are shown in panel (c). Panel (d) shows an example of blowing snow covering the lidar window. In panel (e) artifacts in the cloud radar Doppler velocity are shown together with the vessel tilt (black line). The blue lines in panels (a–d) indicate the flagged periods of the respective issue.

