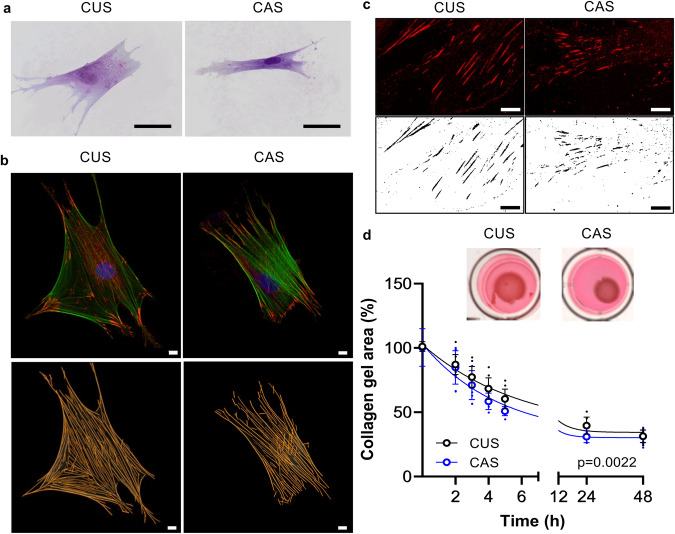
Fig. 1. Cell shape and ECM-cell interactions.
a Representative image of CUS and CAS fibroblasts seeded on a collagen coating. Scale bar: 50 µm. b Representative images of focal adhesions and of F-actin stress fibers in CUS and CAS fibroblasts. To reveal FAs and SFs, cells were labeled with anti-paxillin antibody (red) and with phalloidin (green), respectively. Scale bar: 10 µm. c Representative images of FAs in CUS and CAS fibroblasts. Scale bar: 10 µm. d Representative images of collagen gels retracted by fibroblasts isolated from CUS and CAS. Gel retraction is expressed as percentage of the initial collagen gel area. Data represent means ± SD of measures from three independent experiments performed in triplicate on cell lines kept separate (n = 3 biological replicates for CUS and n = 3 biological replicates for CAS for each time point).

