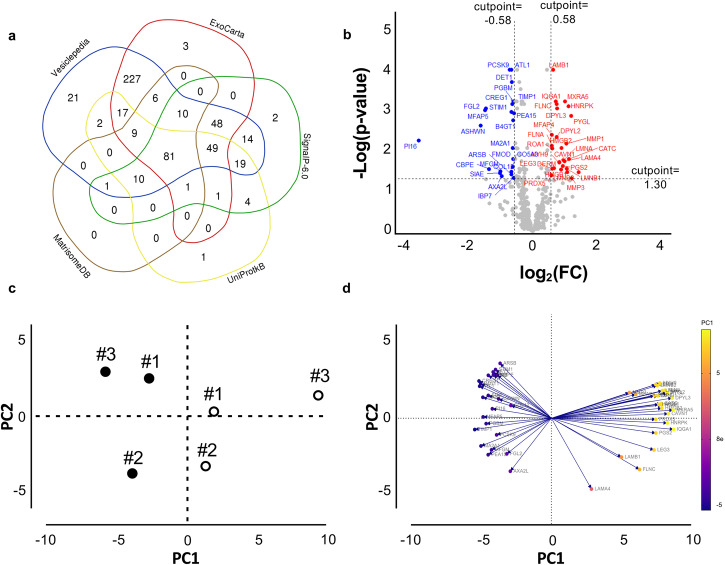
Fig. 2. Fibroblasts’ secretome.
a A Venn diagram shows the distribution of proteins identified by LC-MS/MS in different databases. b Up- (red) and down- (blue) regulated, or unchanged (gray) proteins are shown in the Volcano plot. The X-axis represents the log2 values of the fold change (FC) observed for each protein, and the Y axis depicts the log10 values of the p value of the significance tests between replicates for each protein. Proteins with log2 FC (CAS/CUS) > 0.58 (red) or <−0.58 (blue) and with a p value < 0.05 are displayed. c Principal component analysis (PCA) shows the spatial distribution of secretomes comparing CUS (filled circles) and CAS (empty circles) data. Each dot represents the cell lines from three PXE patients. d Loading plot of data shows the variables that contribute the most to spatial distribution observed in c. The length and the direction of vectors indicate how each ratio readout contributes to the two principal components in the plot.

