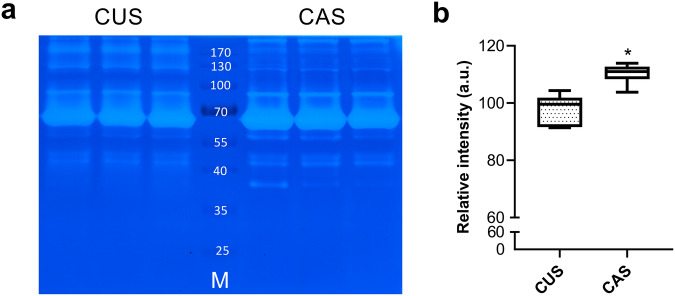
Fig. 3. Potential lytic activity.
a Representative collagen zymography gel loaded with the secretomes of CUS and CAS fibroblasts. M molecular weight (kDa) of standard proteins. b Densitometric analysis of all bands from CUS and CAS fibroblasts. The boxplots show the median (center line), interquartile range (bounds of box), the range of typical data values (whiskers). Data represent means ± SD of measures from three independent experiments performed in triplicate on cell lines kept separate (n = 3 biological replicates for CUS and n = 3 biological replicates for CAS). *p < 0.05.

