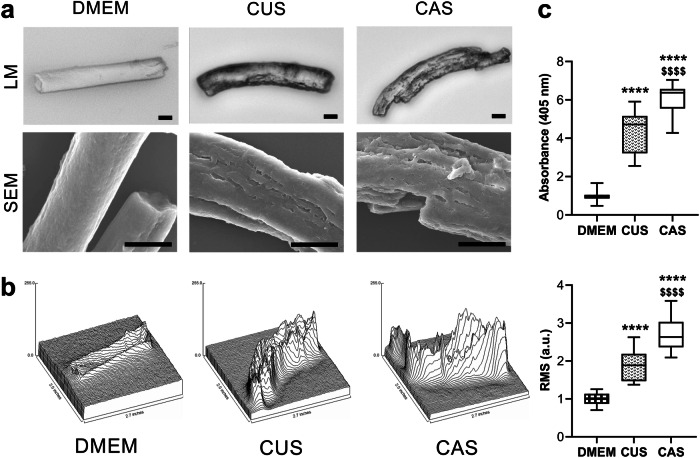
Fig. 4. In vitro mineralization of elastin fibrils.
a Representative images of elastin fibrils observed by light microscopy (LM) and by scanning electron microscopy (SEM). Elastin fibrils were incubated with standard culture medium (DMEM) or with medium conditioned by CUS or CAS fibroblasts. The experiment was performed with conditioned media obtained from each cell line. Scale bar: 10 μm. b Surface plot and root mean square (RMS) roughness of peaks and valleys measured on elastin fibrils incubated with DMEM or with medium conditioned by CUS or CAS fibroblasts. The boxplots show the median (center line), interquartile range (bounds of box), the range of typical data values (whiskers). For each experimental condition, 30 elastin fibrils were analyzed. c Insoluble elastin fibrils treated with standard culture medium (DMEM) or treated with medium conditioned by CUS or CAS fibroblasts were incubated with a calcifying medium for 72 hours and stained with Alizarin red to reveal calcium deposits. The boxplots show the median (center line), interquartile range (bounds of box), and the range of typical data values (whiskers). Data are from three independent experiments (n = 3 for DMEM, n = 9 for CUS, and n = 9 for CAS). ****p < 0.001 CUS or CAS vs DMEM; $$$$p < 0.0001 CAS vs. CUS.

