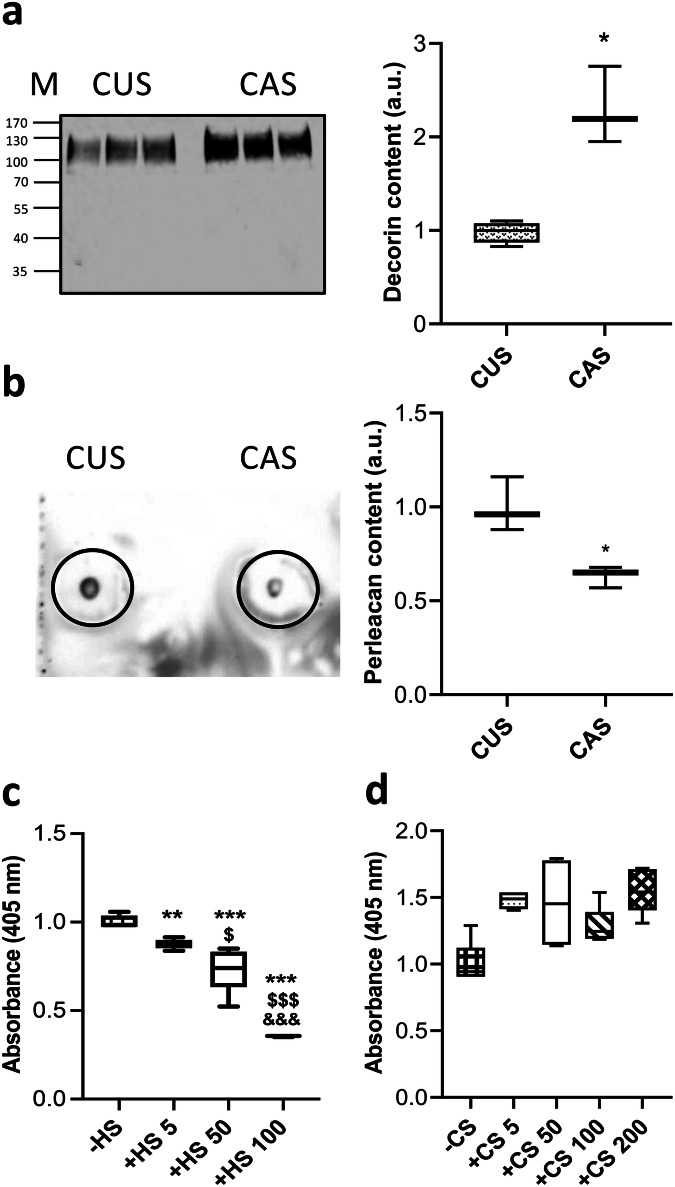
Fig. 5. Detection of differentially expressed proteoglycans and mineral deposition.
a Representative WB of decorin in media conditioned by CUS or CAS fibroblasts (M molecular weight; kDa) and quantification of decorin expression based on WB. Total protein expression served as loading control (Supplementary Fig. 1a, b). Data represent means ± SD of measures from two independent experiments performed in triplicate on cell lines kept separate (n = 3 biological replicates for CUS and n = 3 biological replicates for CAS). The level of decorin in medium conditioned by CUS fibroblasts was set to 1. *p = 0.0137. b Representative dot-blot of perlecan in media conditioned by CUS or CAS fibroblasts (Supplementary Fig. 1c). Data represent means ± SD of measures from two independent experiments performed in triplicate on cell lines kept separate (n = 3 biological replicates for CUS and n = 3 biological replicates for CAS). The level of perlecan in medium conditioned by CUS fibroblasts was set to 1. *p = 0.015. c, d Alizarin red assay on insoluble elastin fibrils coacervated in the absence (−) or in the presence (+) of HS (from 5 to 100 μg) or of CS (from 5 to 200 μg), digested with medium conditioned by CAS fibroblasts and incubated with calcifying medium for 72 hours. Data are from three independent experiments performed in technical triplicates (n = 3 for each experimental condition). Calcium level of ELN fibrils coacervated without HS or without CS was set to 1. The boxplots show the median (center line), interquartile range (bounds of box), the range of typical data values (whiskers). **p < 0.01; ***p < 0.001 ELN + HS vs. ELN; $p < 0.05; $$$p < 0.001 50 or 100 μg HS vs 5 μg HS; &&&p < 0.001 100 μg HS vs 50 μg HS.

