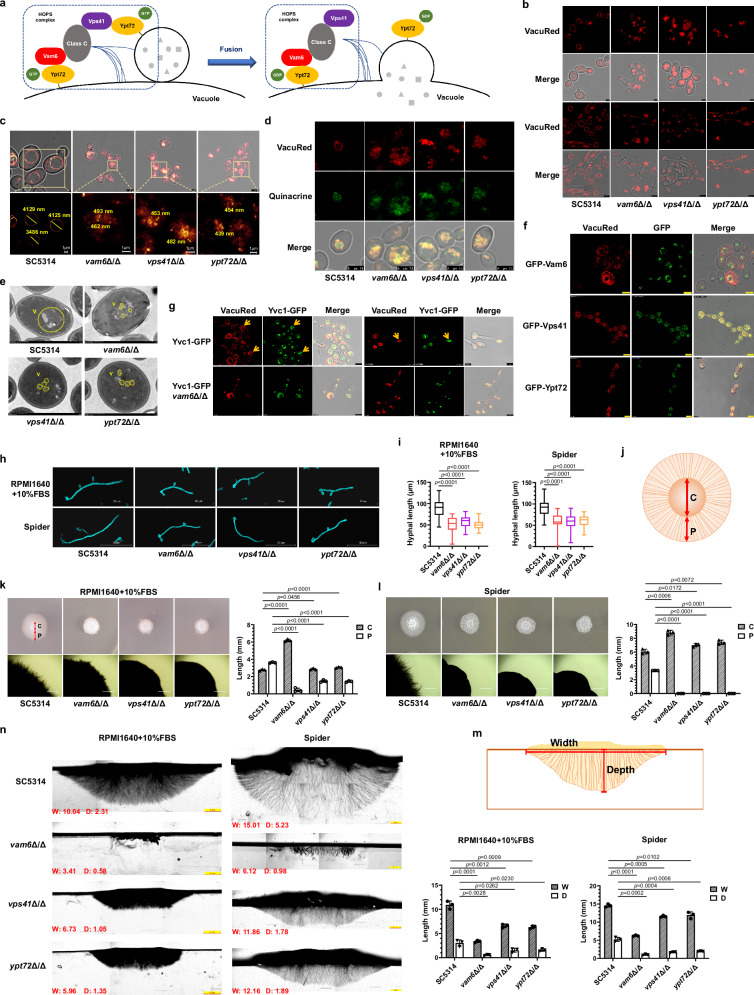
Fig. 2. The deficiency in HOPS complex abolishes vacuole fusion and impairs filamentous growth in C. albicans.
a Identified process of HOPS-complex-mediated vacuole fusion in fungal cells. b Imaging of vacuole membrane stained by VacuRed. Scale bars = 5 μm. c Measurement of vacuolar diameters in C. albicans. Scale bars = 1 μm (lower panel). d Imaging of vacuole compartment stained by quinacrine. Scale bars = 7.5 μm. e Transmission electron microscope images in C. albicans. The yellow circles represent vacuoles (V). Scale bars = 1 μm. f The colocalization of Gfp-tagged Vam6, Vps41 and Ypt72 with VacuRed. Scale bars = 5 μm. g Imaging of GFP-tagged Yvc1 with VacuRed. The yellow arrows represent the site of fusion. Scale bars = 5 μm. h The hyphal morphology in C. albicans. Scale bars = 50 μm. i The hyphal length in C. albicans. Box plots indicate median (middle line), 25th, 75th percentile (box) and minimum and maximum value as well as outliers (single points). n = 50 hyphae. j The model of top view of hyphal colony on solid agar. The diameter of center part without hyphae was defined as C. The distance of visible hyphal part scattering around the central region were defined as P. k, l The hyphal morphology on solid media. The C and P values were quantified by Image J. Data were presented as mean ± SD. n = 3 colonies. Scale bars = 1000 μm. m The model of vertical section of hyphal colony on solid agar. Width (W), the width of colony ranges under the surface of agar; Depth (D), the maximum distance of hyphae penetrating into agar from the surface of agar. n Vertical sections of hyphal colonies on solid media were observed by microscopy. The W and D values (mm) were quantified by Image J. Scale bars = 1 mm. Data were presented as mean ± SD. n = 3 colonies. Two-tailed unpaired t-test (i, k, l, n). The representative images shown are from 3 biological repeats (b–g, k, l, n). Source data are provided as a Source Data file.

