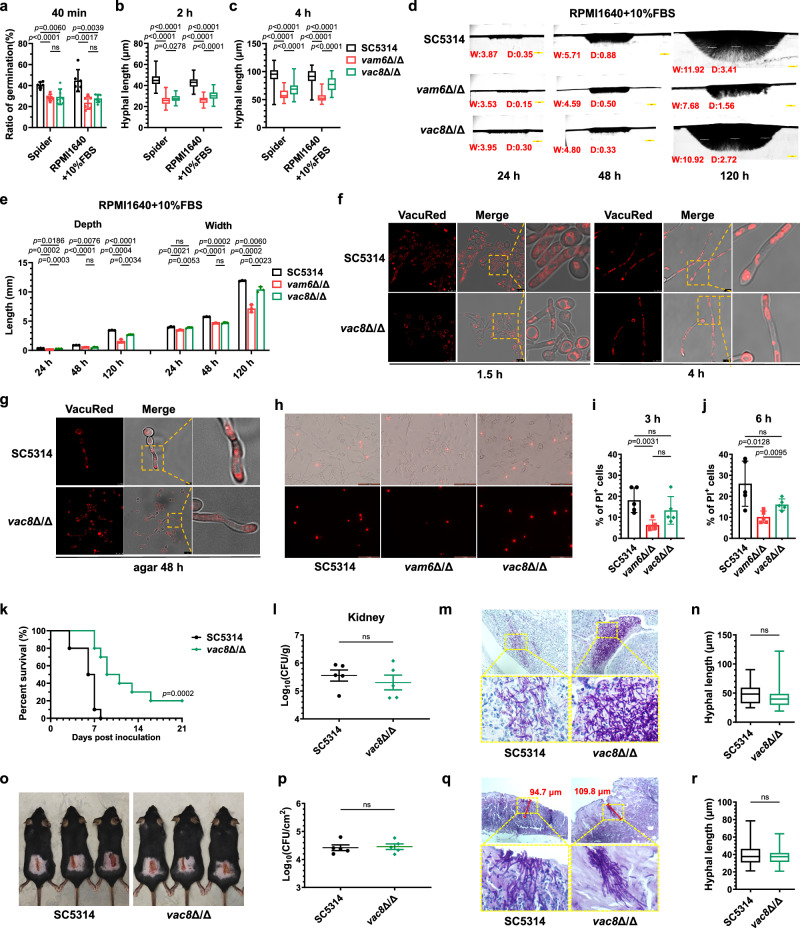
Fig. 7. The vac8 null mutant with large vacuoles showed normal ability to penetrate solid media and slightly decreased virulence.
a The ratio of germination in C. albicans induced for 40 min. n = 6 fields. b, c The hyphal length induced for 2 h and 4 h. n = 50 hyphae. d, e Vertical sections of hyphal colonies on solid agar. Colonel width (W) and depth (D) (mm) were quantified by Image J. n = 3 colonies. Scale bars = 1 mm. f, g Vacuoles in hyphae cultured in liquid RPMI1640 + 10% FBS or solid Spider medium. Scale bars = 7.5 μm in (f), 2.5 μm (upper), and 10 μm (lower) in (g). The representative images shown are from 3 biological replicates (d, f, g). h Murine peritoneal macrophages were co-incubated with C. albicans (MOI = 1) for 3 h and stained with PI. Scale bars = 50 μm. i, j The percentage of PI-positive murine macrophages co-incubated with fungi (MOI = 1). n = 5 fields. k The survival percentage of mice infected with C. albicans. n = 10 mice. l The fungal burden in kidneys. n = 5 mice. m The kidneys of mice were made pathological sections with PAS staining. Scale bars = 100 μm. n The hyphal length in kidneys was measured by Image J. n = 35 hyphae. o The exposed back skin with fungal-infected damage on day 7. p The fungal burden in skin of mice. n = 5 mice. q The pathological images of infected skin stained by PAS. The dimension of skin damage was quantified by the maximum depth of penetrated hyphae measured by Image J. Scale bars = 100 μm. r The hyphal length in damaged skin was measured by Image J. n = 25 hyphae. Data were presented as mean ± SD (a, e, i, j, l, p). Box plots indicate median (middle line), 25th, 75th percentile (box), and minimum and maximum value as well as outliers (single points) (b, c, n, r). Log-rank (Mantel-Cox) test (k), two-tailed unpaired t-test (a–c, e, i, j, l, n, p, r). Source data are provided as a Source Data file.

