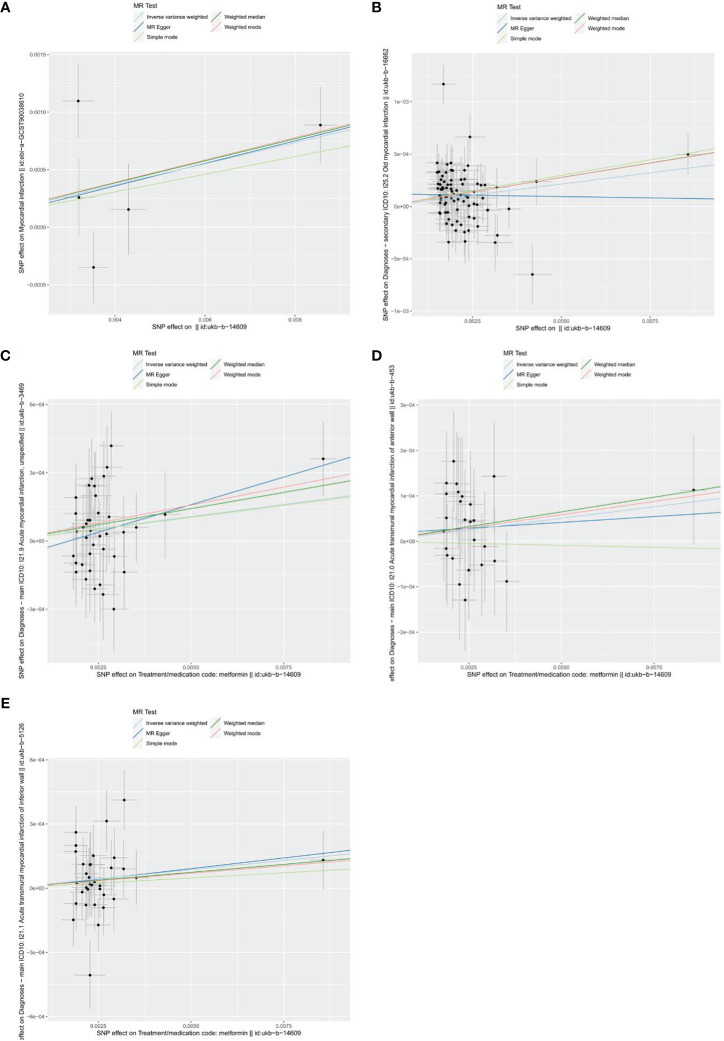
Figure 5.
Scatters plots of the effect of metformin on outcomes. (A) exposure metformin and outcome myocardial infarction; (B) exposure metformin and outcome old myocardial infarction; (C) exposure metformin and outcome acute myocardial infarction; (D) exposure metformin and outcome acute transmural myocardial infarction of anterior wall; (E) exposure metformin and outcome acute transmural myocardial infarction of inferior wall. The black points represent instrumental variables. The horizontal axis represents the effect of SNPs on exposure (metformin). The vertical axis represents the effect of SNPs on the outcomes. Colored lines represent the results of MR analysis based on five methods.

