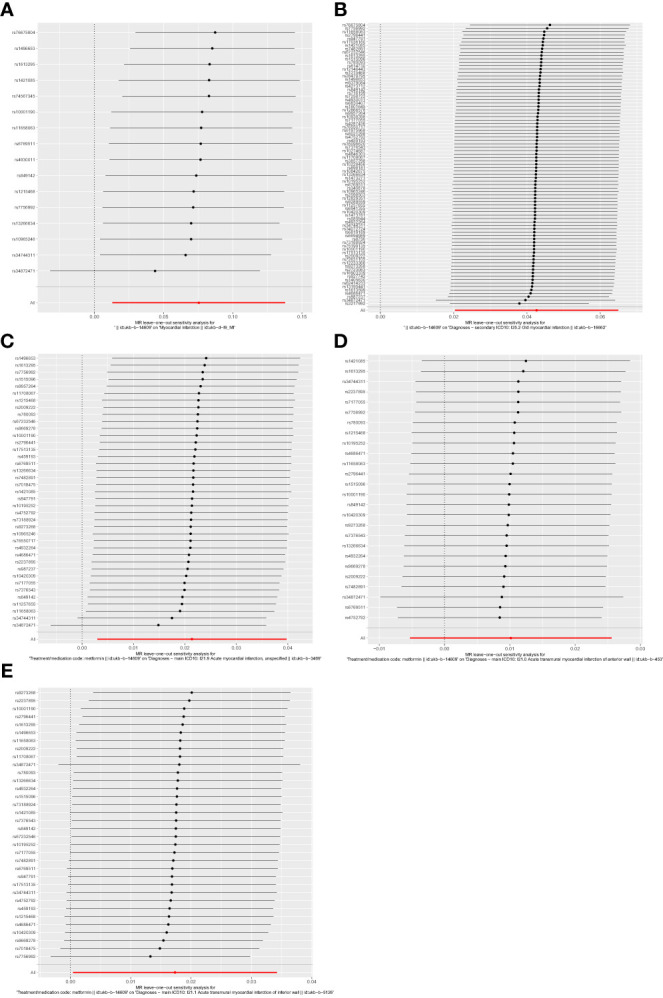
Figure 6.

Forest plots of leave-one-out analysis. (A) outcome of myocardial infarction; (B) outcome of old myocardial infarction; (C) outcome of acute myocardial infarction; (D) outcome of acute transmural myocardial infarction of anterior wall; (E) outcome of acute transmural myocardial infarction of inferior wall. The positions of the red points are greater than zero. The black dots are positioned on the right side of the invalid line. This indicates that removing any of the SNPs will not significantly impact the results.
