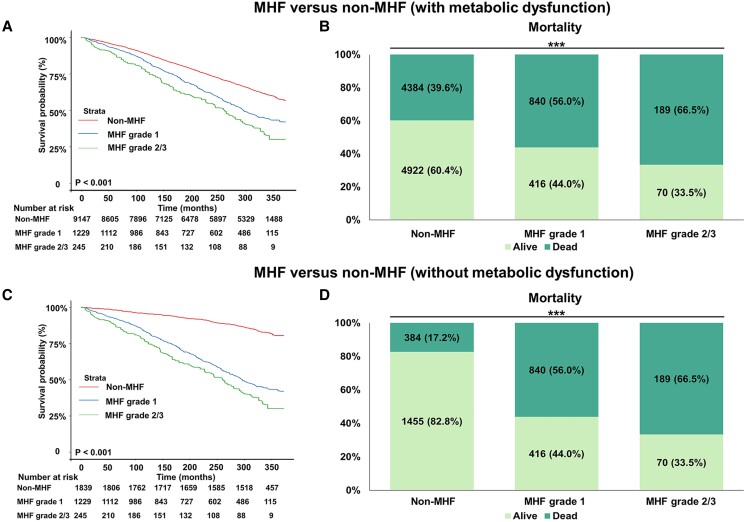
Figure 3.
The weighted survival analysis of MHF and non-MHF (with or without metabolic dysfunction) in the NHANES III (from 1988 to 1994). The Kaplan–Meier curves of MHF and non-MHF (A, C) and the proportion of mortality in MHF and non-MHF (B, D). The data in the percentage column chart are real numbers (weighted percentage, %). *P < .05; **P < .005; ***P < .001. Abbreviations: MHF, metabolic hyperferritinaemia.

