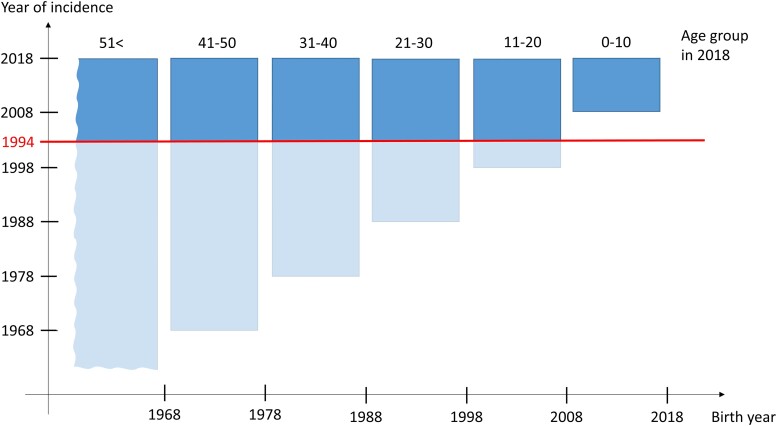
Figure 7.
Year of incidence by birth year for all age groups. The blue area indicates the birth year and year of incidence range for each age group separately. For example, FD/MAS cases belonging to age group 11 to 20 in 2018 were born between 1998 and 2008 and were incident between 1998 and 2018. The total blue bar represents the total of the patients with FD/MAS in the age group. The red line marks the year 1994, where the ICD coding changed from the ninth to the tenth revision. The dark blue component of the bar represents the patients actually diagnosed in the ICD-10 coding system and included in this study. The light blue component represents the patients with FD/MAS coded by ICD-9 before 1994. These patients are missed in the current study if they were not reportedly diagnosed in the ICD-10 system. The chart reflects that in older age groups, higher ratios of cases are missed in this study, that is, the underestimation is higher for older age groups.

