
Figure 5.
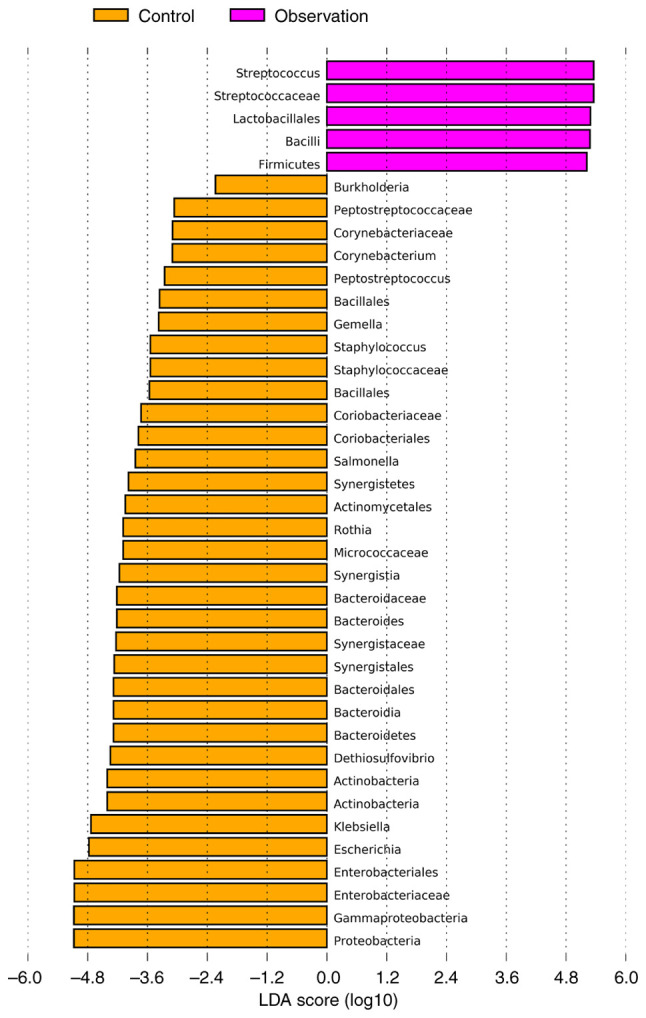
The most differentially abundant taxa between control and observation groups (LDA score >2) which was generated from LEfSe analysis. LDA, linear discriminant analysis; LEfSe, LDA effect size.
Official websites use .gov
A
.gov website belongs to an official
government organization in the United States.
Secure .gov websites use HTTPS
A lock (
) or https:// means you've safely
connected to the .gov website. Share sensitive
information only on official, secure websites.
The most differentially abundant taxa between control and observation groups (LDA score >2) which was generated from LEfSe analysis. LDA, linear discriminant analysis; LEfSe, LDA effect size.