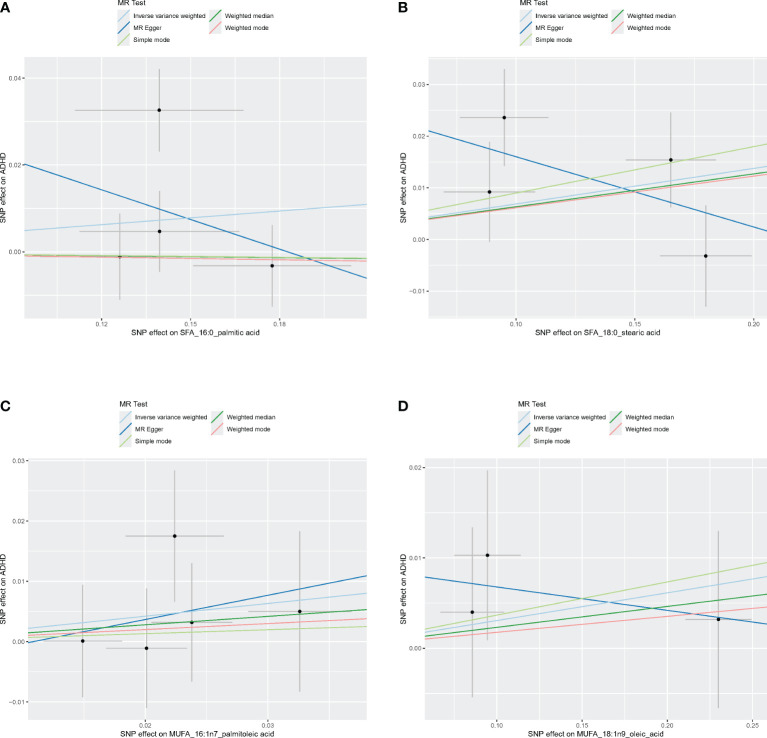
Figure 4.
Scatter plots of SFA and MUFA. (A) Scatter plots of 16:0. (B) Scatter plots of 18:0. (C) Scatter plots of 16:1n7. (D) Scatter plots of 18:1n9. Scatter plots of the five MR results from the two SFAs and two MUFAs related to ADHD. Each point in the scatter plot represents an IV. The line on each point reflects the 95% CI, and the horizontal coordinate is the effect of SNPs on 16:0, 16:1n7, 18:0, 18:1n9. The vertical coordinate is the effect of SNPs on ADHD. SNP effects were plotted into lines for the inverse-variance weighted test (light blue line), MR-Egger regression (dark blue line), simple mode (light green line), weighted median (dark green line), and weighted mode (pink line).

