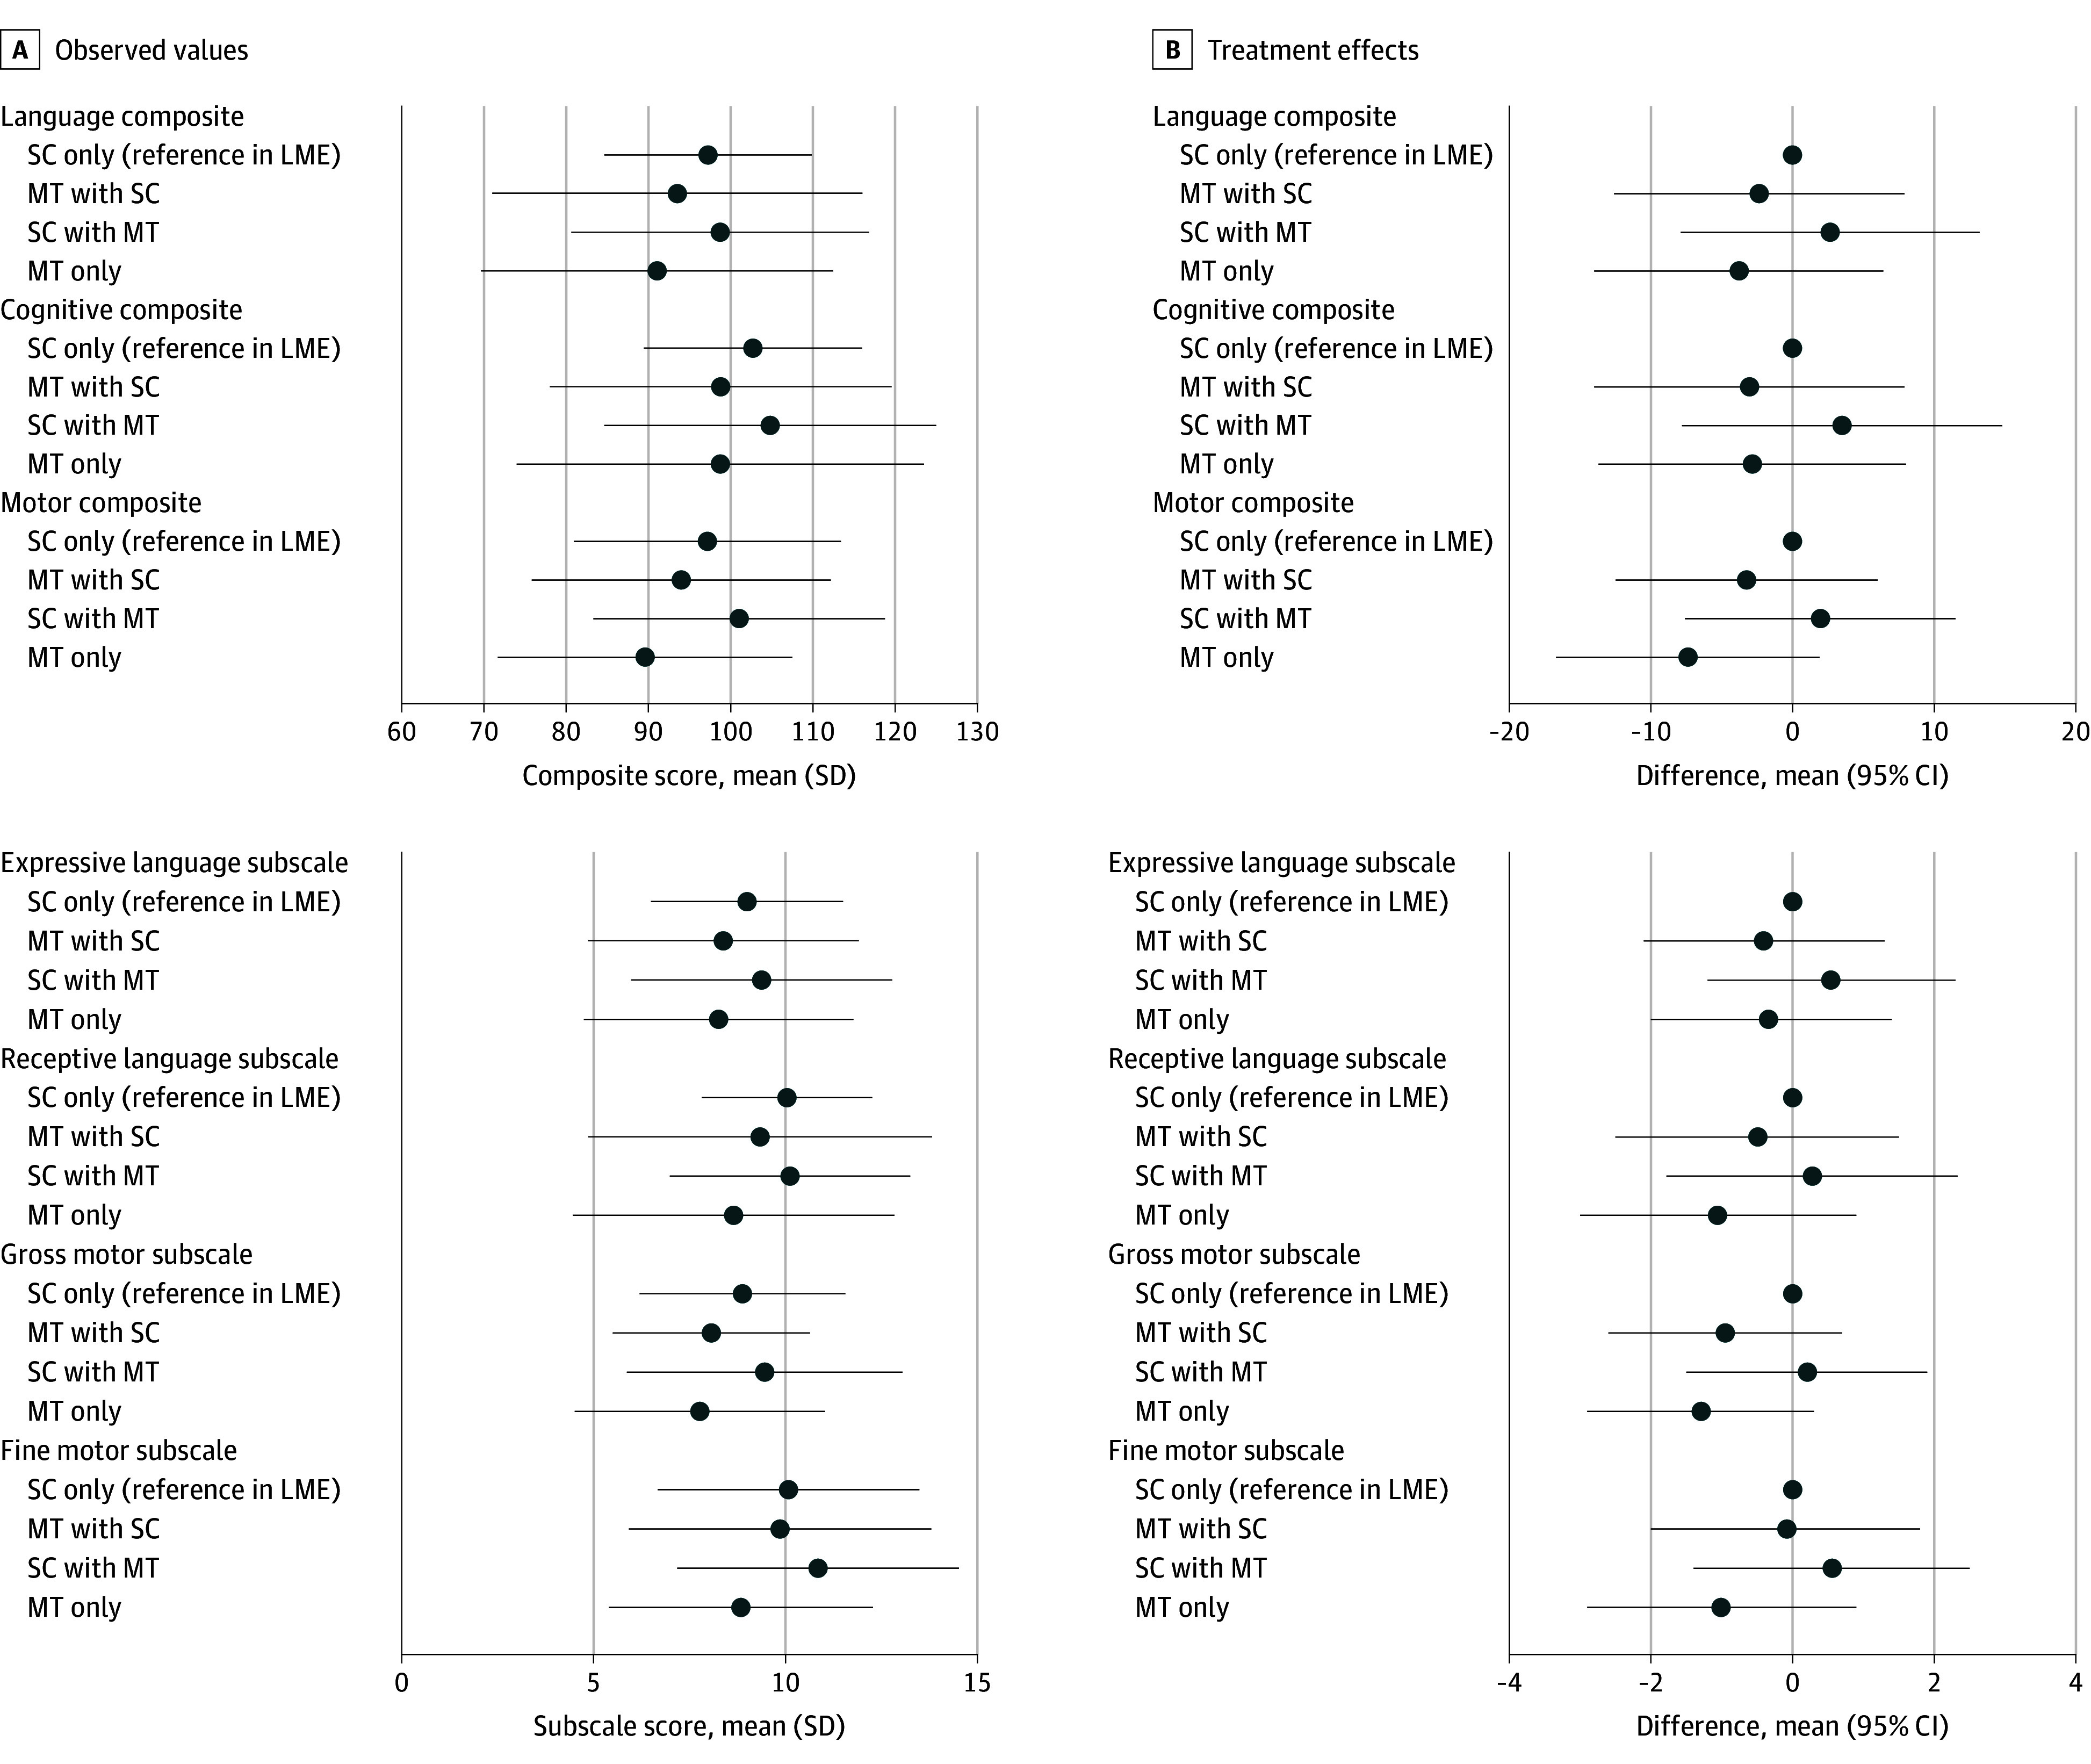
Figure 2. Mean Bayley Scales of Infant and Toddler Development, Third Edition Composite and Subscale Scores and Treatment Effects in the 4 Intervention Groups.

LME indicates linear mixed-effects models; MT, music therapy; and SC, standard care. Circles represent mean composite and subscale scores and mean differences, and whiskers represent SDs for the composite and subscale scores and 95% CIs for the mean differences.
