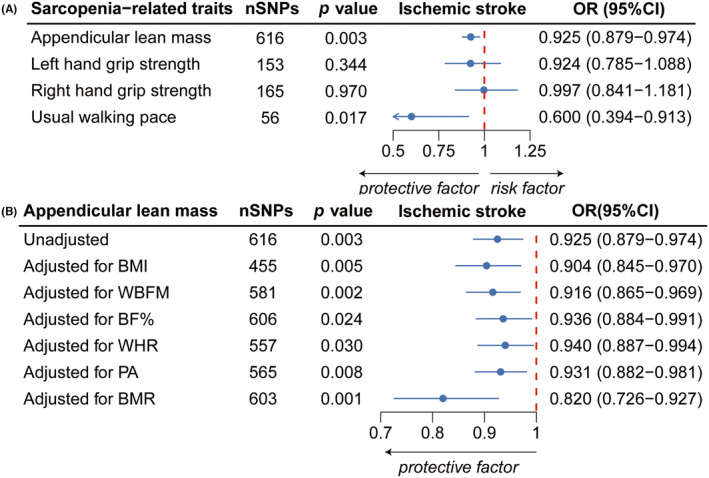
FIGURE 2.

Forest plots of the association between sarcopenia‐related traits and IS. (A) Forest plot presenting the causal estimates between sarcopenia‐related traits and IS as determined by UVMR. (B) Forest plot showing the causal estimates between ALM and IS, before and after adjustments for BMI, WBFM, BF%, WHR, levels of PA, and BMR using MVMR. ALM, appendicular lean mass; BMI, body mass index; BF%, body fat percentage; BMR, basal metabolic rate; IS, ischemic stroke; MVMR, multivariable Mendelian randomization; OR, odds ratio; PA, physical activity; SNPs, single nucleotide polymorphisms; UVMR, univariable Mendelian randomization; WBFM, whole‐body fat mass; WHR, waist‐to‐hip ratio.
