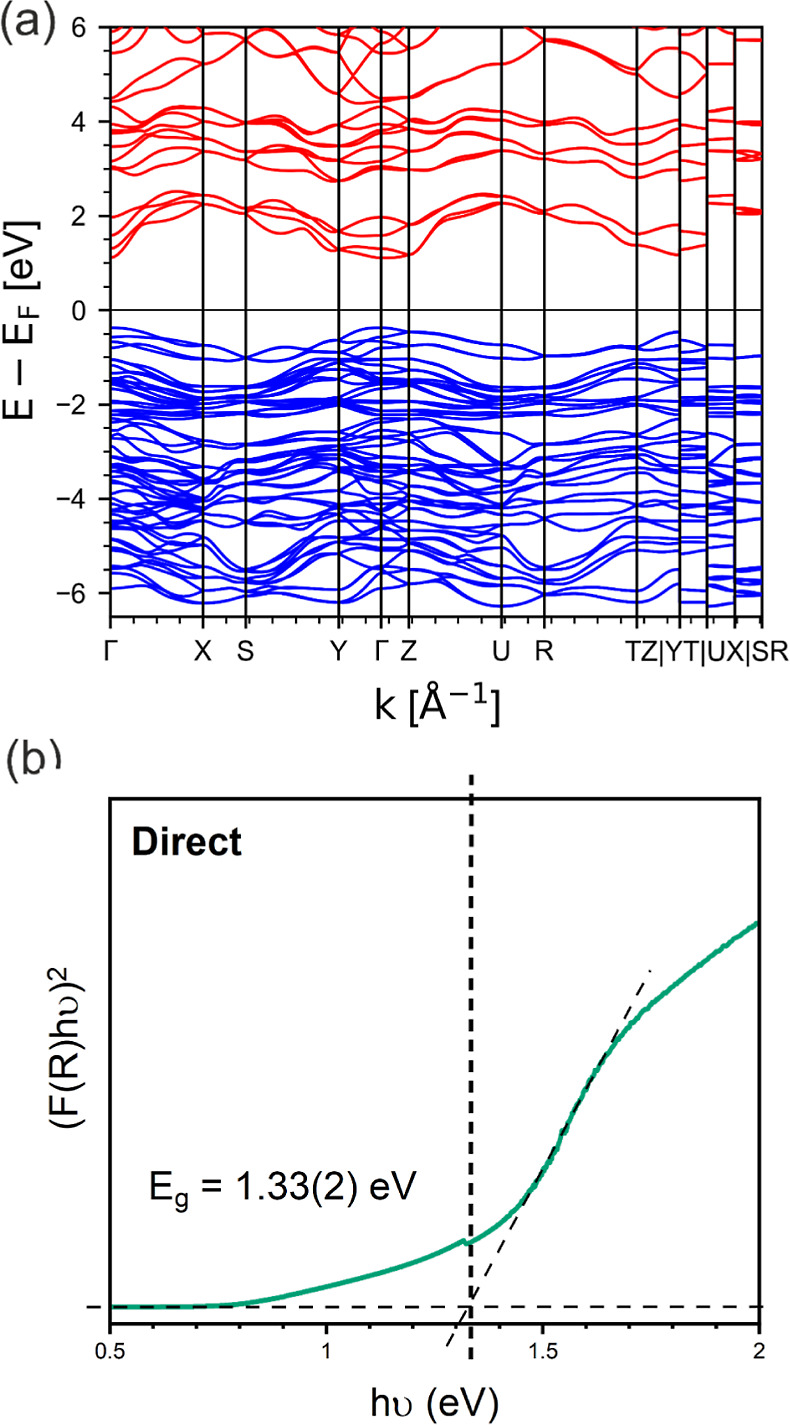
Figure 4.

(a) Band structure of CuBiSeCl2 calculated using the HSE06 functional with SOC contributions. Valence band electronic states are shown in blue and the conduction band electronic states in red. (b) Tauc plot derived from UV–vis spectrometry measurements. The direct band gap for CuBiSeCl2 is extrapolated using the Tauc plot and determined to be 1.33(2) eV.
