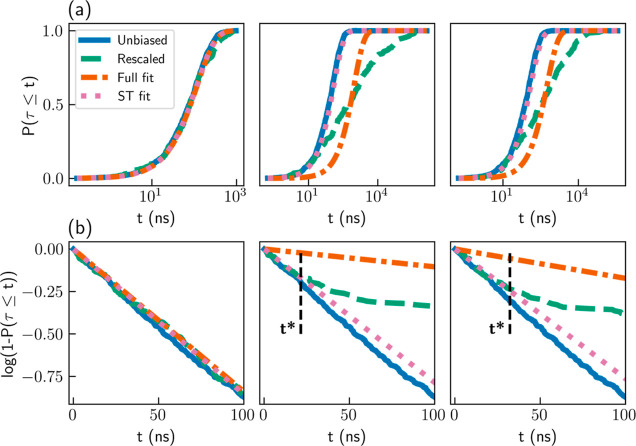
Figure 1.
(a) CDF profiles and (b) survival functions for simulations of the Wolfe–Quapp potential. Results for unbiased FPTs (blue solid lines), rescaled FPTs (dashed green lines), exponential fits to the rescaled CDF in the entire range (orange dashed–dotted lines), and linear fits to the survival functions at t ≤ t* (pink dotted lines). Results are shown for iMetaD simulations using a good CV and a bias deposition rate of 10 ns–1 (left), a good CV and a bias deposition rate of 1000 ns–1 (middle), and a suboptimal CV and a bias deposition rate of 200 ns–1 (right). The black dashed lines mark t = t*.

