Figure 2.
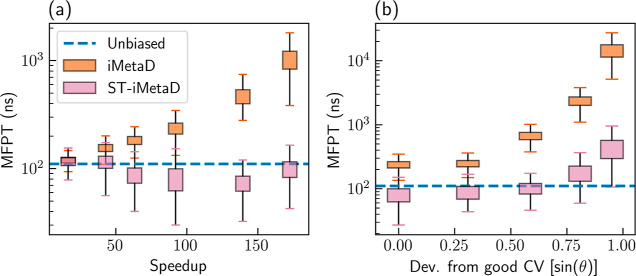
(a) Estimated MFPTs as a function of the speedup for the Wolfe–Quapp potential using a good CV and different bias deposition rates from 10 to 1000 ns–1. (b) Estimated MFPTs for a bias deposition rate of 200 ns–1 and different choices of CV. The blue lines mark the unbiased MFPT value. We employed either standard iMetaD (orange) or ST-iMetaD (pink). The boxes show the range between the first and third quartiles and the whiskers show extreme values within 1.5 IQR below and above these quartiles.

