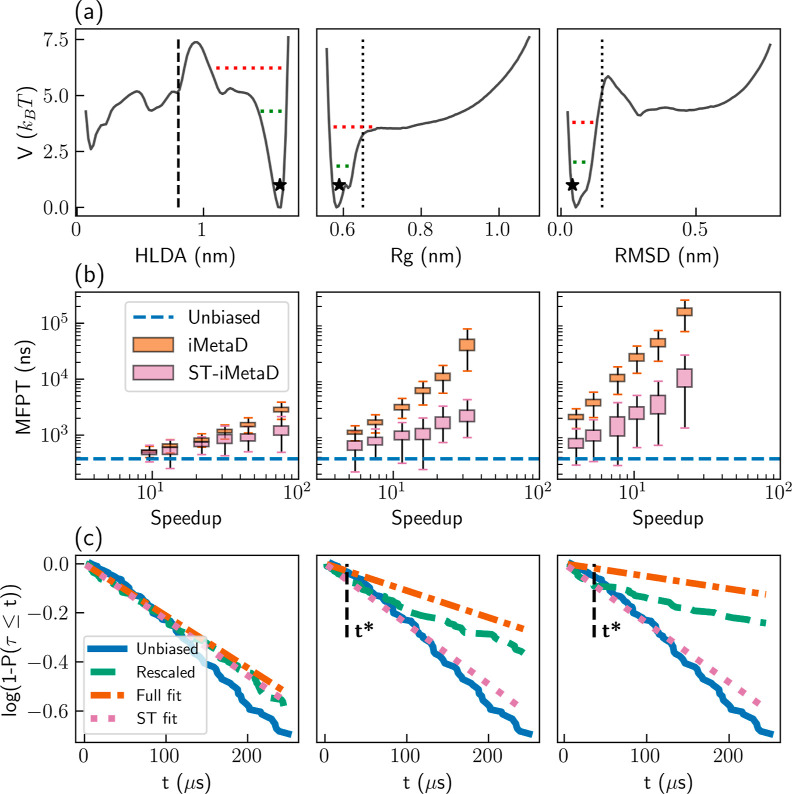
Figure 5.
Results for the simulation of solvated chignolin using the HLDA-based CV (left), the radius of gyration (middle), and the C-alpha RMSD (right). (a) FESs. The vertical dashed line marks the first-passage criterion and the dotted vertical lines mark the average radius of gyration and C-alpha RMSD at first-passage events. The horizontal green and red lines highlight average maximal bias heights at t* and 10t*, respectively. The black stars mark the values of the CVs at the initial folded configuration. (b) Estimated MFPTs obtained with standard iMetaD (orange) and ST-iMetaD (pink). The boxes show the range between the first and third quartiles and the whiskers show extreme values within 1.5 IQR below and above these quartiles. The blue dashed lines show the unbiased MFPT. (c) Survival functions for unbiased FPTs (blue solid lines), rescaled FPTs of simulations with a bias deposition rate of 1 ns–1(dashed green lines), exponential fits to the rescaled CDF in the entire range (orange dashed–dotted lines), and linear fits to the survival function at t ≤ t* (pink dotted lines). The black dashed lines show the estimated t*.

