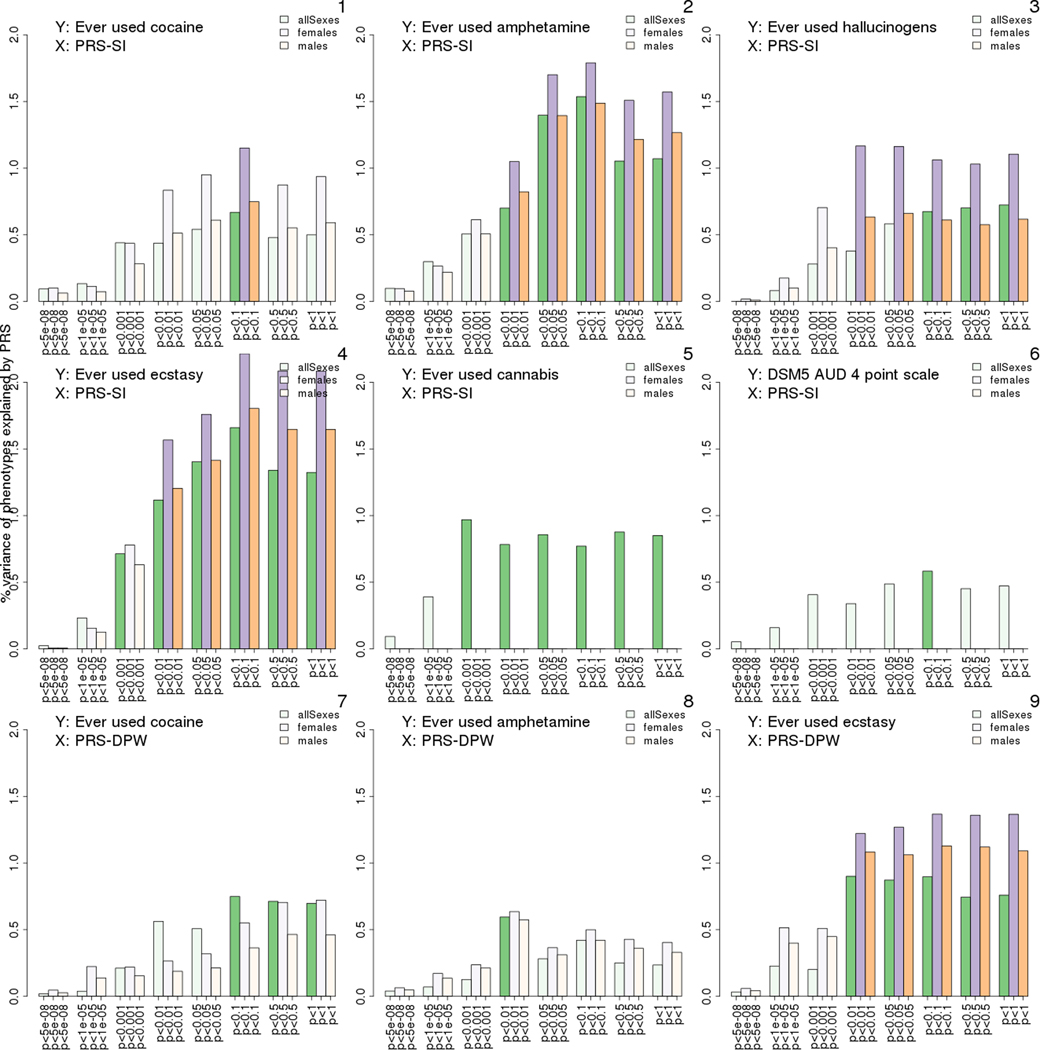
Fig. 1.
Percentage variance of liability to illicit substance use (disorder) explained by polygenic risk scores (PRS) for smoking initiation (PRS-SI) or drinks per week (PRS-DPW) in males (M), females (F) and both sexes (F + M). Bar height represents the percent of the variation in a target phenotype explained by a PRS. Associations that remained significant after accounting for multiple testing (adjusted p-value threshold: 7.14e-04) are shown as green in both sexes combined, as orange in females and as purple in females. Bars from non-significant associations are shown in pale colour. Bar groups on the x-axis indicate the eight p-value thresholds at which the PRSs were calculated: 5e-08, 1e-05, 1e-03, 1e-02, 0.05, 0.1, 0.5, and 1 (For interpretation of the references to colour in this figure legend, the reader is referred to the web version of this article).

