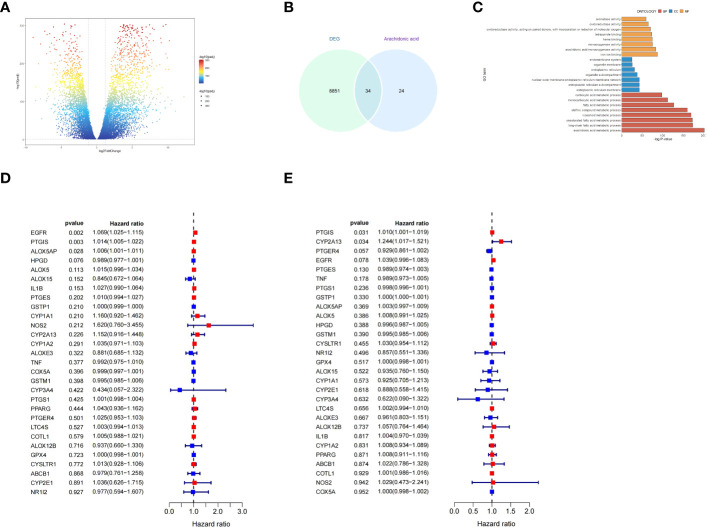
Figure 5.
Functional and signaling pathway enrichment analysis of AA metabolism related genes in OC. (A) Volcano plot of DEGs between ovarian cancer and non-tumor tissues based on the TCGA (OV for ovarian cancer, accessed on 20240329) and GTEx (Ovary, accessed on 20240329) database. (B) Venn diagram showing the number of DEGs and AA metabolism related genes; the intersection part is the total number of genes in the two datasets. (C) Results of GO analysis of overlapping DEGs. (D, E) Forest plot demonstrating the univariate Cox model results of 34 OS/PFS-related key genes of AA metabolism.

