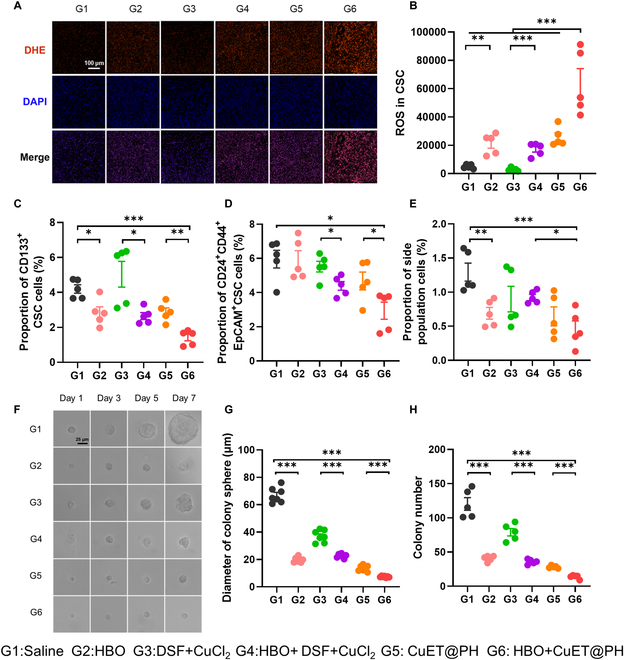
Fig. 6.

HBO helps CuET@PH NPs eliminate Panc02 CSCs in vivo. (A) ROS immunofluorescence of tumor tissues after different treatments (scale bar: 100 μm). (B) Levels of CSCs ROS in tumor tissues of different treatments by flow cytometry (mean ± SEM, n = 5). Proportion of CD133+ CSCs (C), CD24+CD44+ CSCs (D), and side-population cells (E) in tumor tissues of different treatments by flow cytometry (mean ± SEM, n = 5). (F) 3D fibrin gel experiments with cancer cells derived from tumor tissues of different groups (scale bar: 25 μm). (G) Diameter of colony sphere on day 7 of different groups (mean ± SEM, n = 7). (H) Colony number on day 7 of different groups (mean ± SEM, n = 5). Statistical significance was calculated by t test. *P < 0.05, **P < 0.01, ***P < 0.001.
