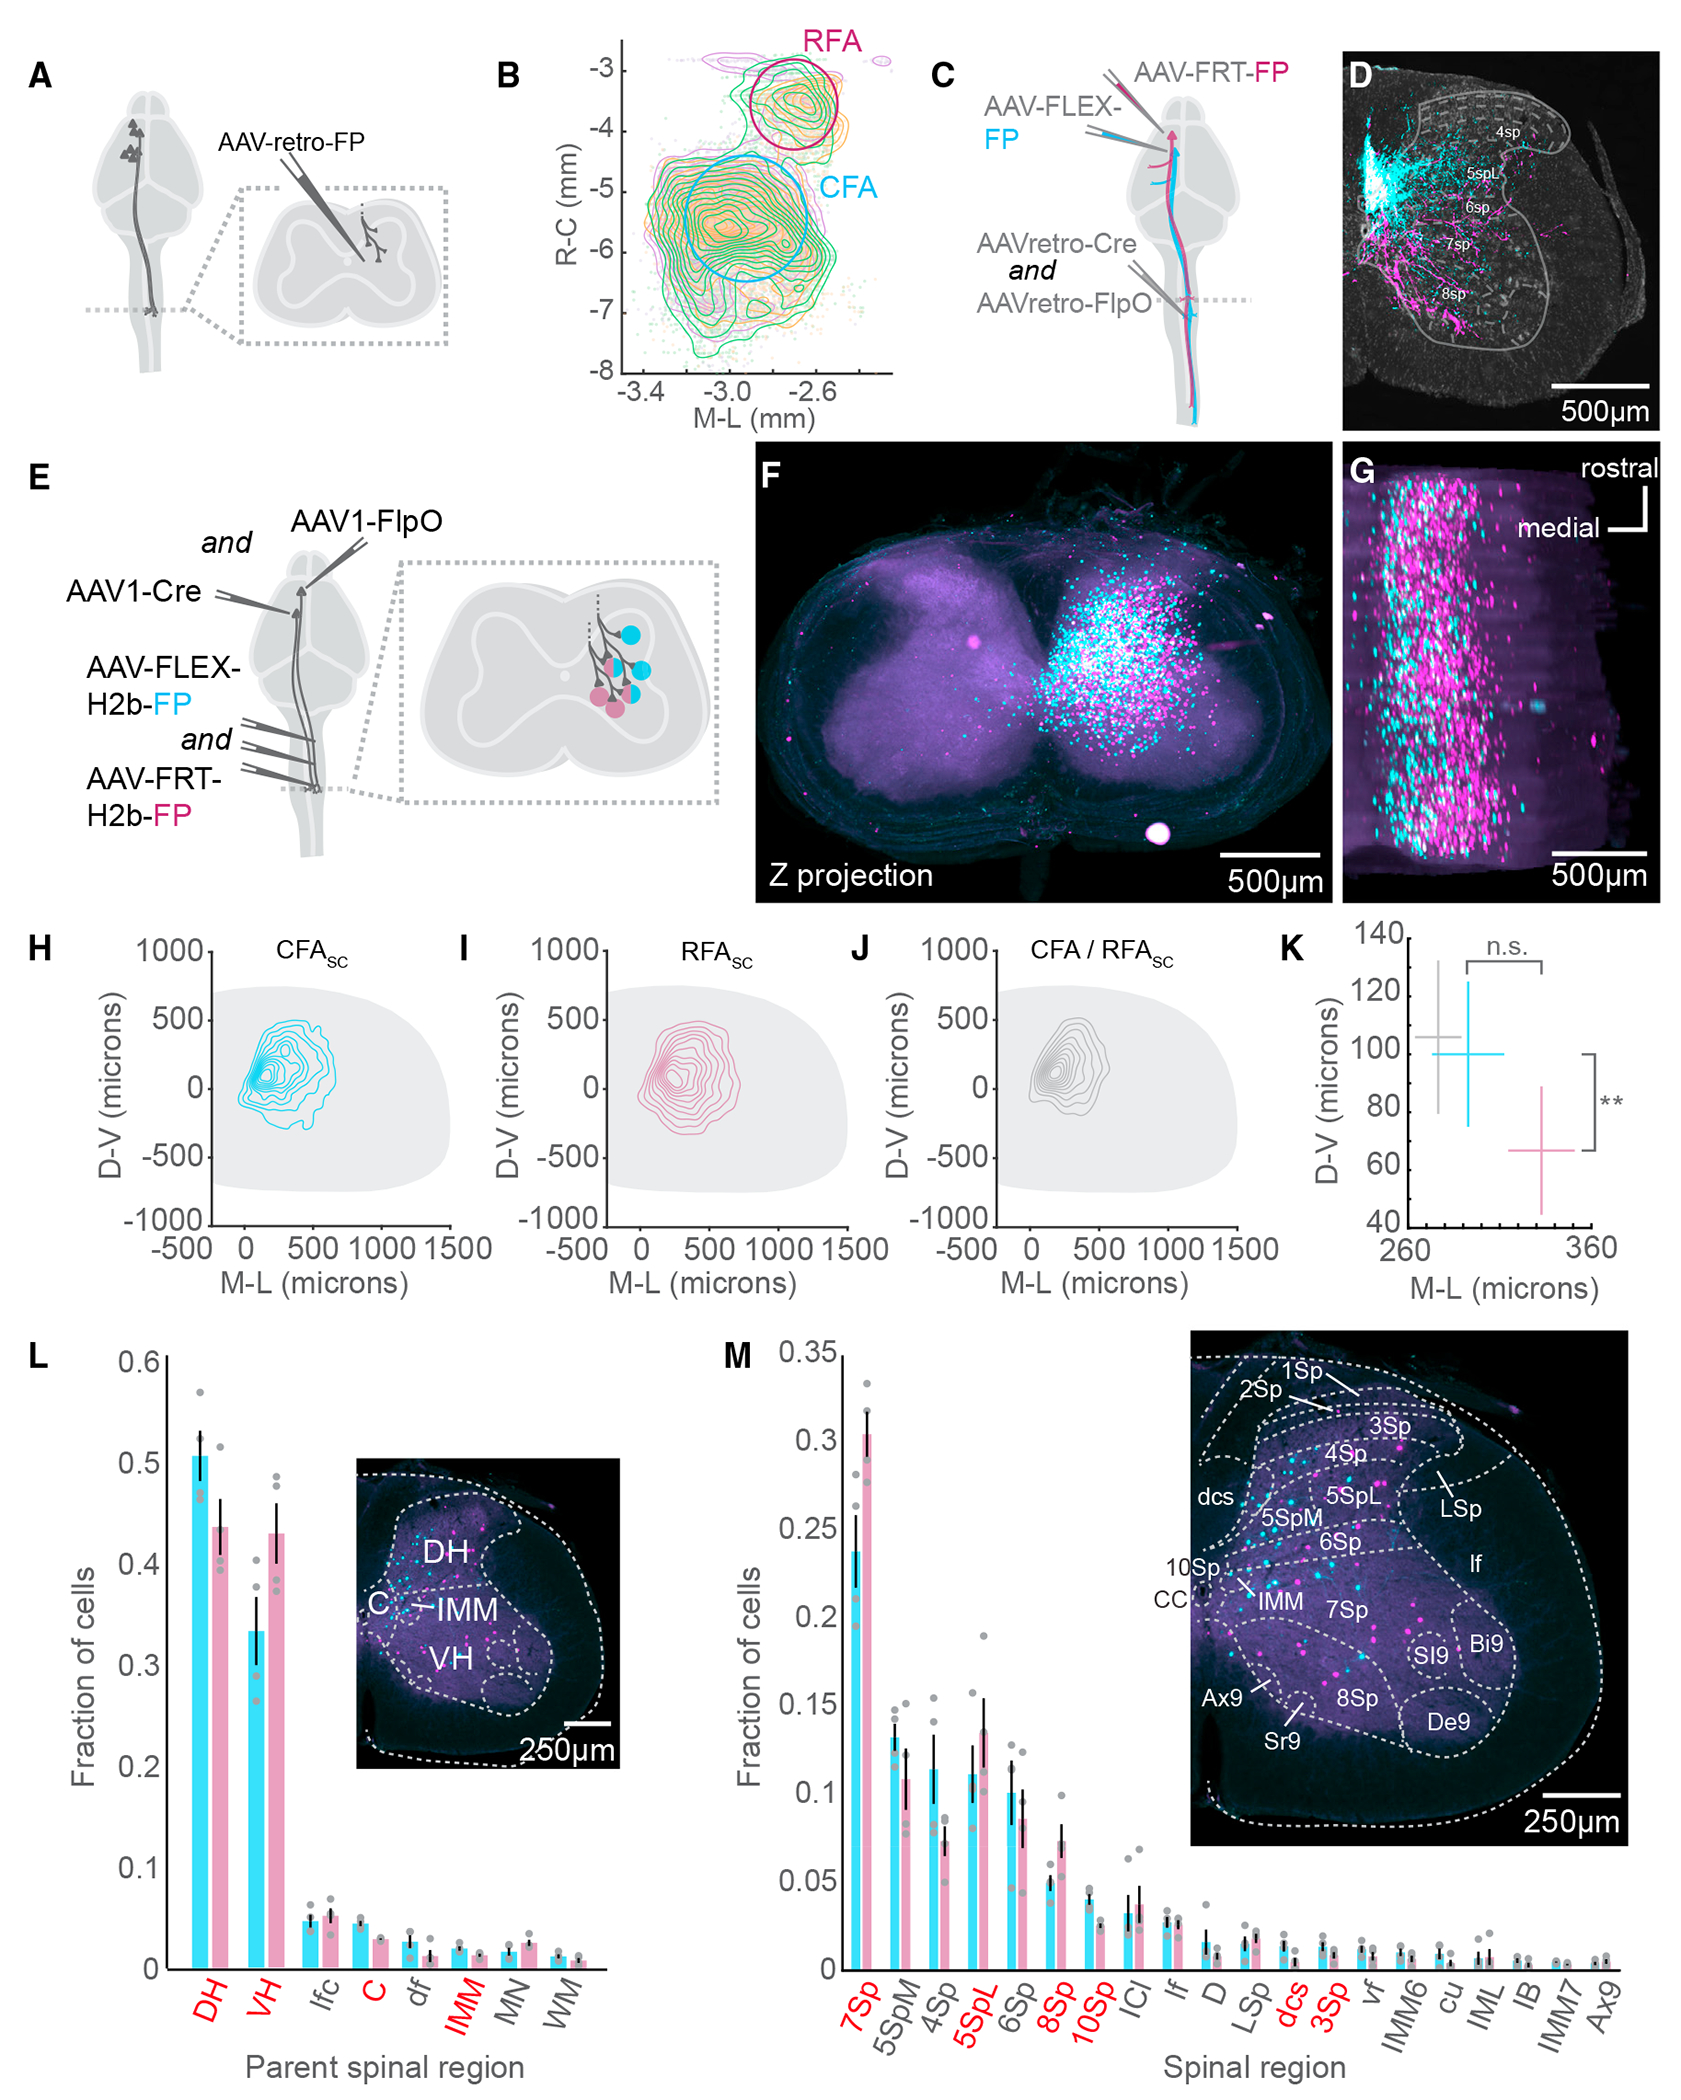
Figure 1. CFA and RFA corticospinal neurons target neurons in distinct spinal regions.

(A) Strategy to label brain-wide inputs to the cervical spinal cord.
(B) Top-down view of a 3D reconstruction of the mouse brain showing CSNs as individual points. A contour map of CSN cell bodies is superimposed. The approximate locations of CFA and RFA are indicated. The three colors indicate samples from 3 separate experiments (N = 3 mice for A and B).
(C) Strategy to simultaneously label CFA and RFA CSNs.
(D) Photomicrograph of a transverse section of the spinal cord with fluorescently labeled CFA (cyan) and RFA (magenta) axons. Neurotrace is in gray. Major spinal laminae are demarcated (representative of N = 6 mice for C and D).
(E) Strategy to simultaneously label spinal neurons that are innervated by CFA or RFA.
(F) z stack projection of aligned photomicrographs of the cervical spinal cord. CFASC is in cyan and RFASC is in magenta (representative of N = 4 mice for [F] and [G]).
(G) Rotated 3D reconstruction of a section of the cervical spinal cord.
(H) Contour plot of CFASC labeling. D-V, dorsoventral; M-L, mediolateral (N = 4 mice for [H]–[M]).
(I) Contour plot of RFASC labeling.
(J) Contour plot of double-labeled neurons (CFA/RFASC neurons).
(K) Mean centroid positions of CFASC, RFASC, and CFA/RFASC populations.
(L) The major spinal cord structures containing CFASC and RFASC neurons. Regions colored red indicate a significant difference between CFASC and RFASC fractions. The inset is a photomicrograph with major spinal structures indicated.
(M) The spinal cord laminae and nuclei containing CFASC and RFASC neurons. The inset is a photomicrograph with spinal structures indicated.
Refer to Table S1 for a complete list of the spinal cord structures and their corresponding acronyms. Data are represented as mean ± SEM. Red text in (F) and (M): p < 0.05, **p < 0.01
See also Figure S1.
