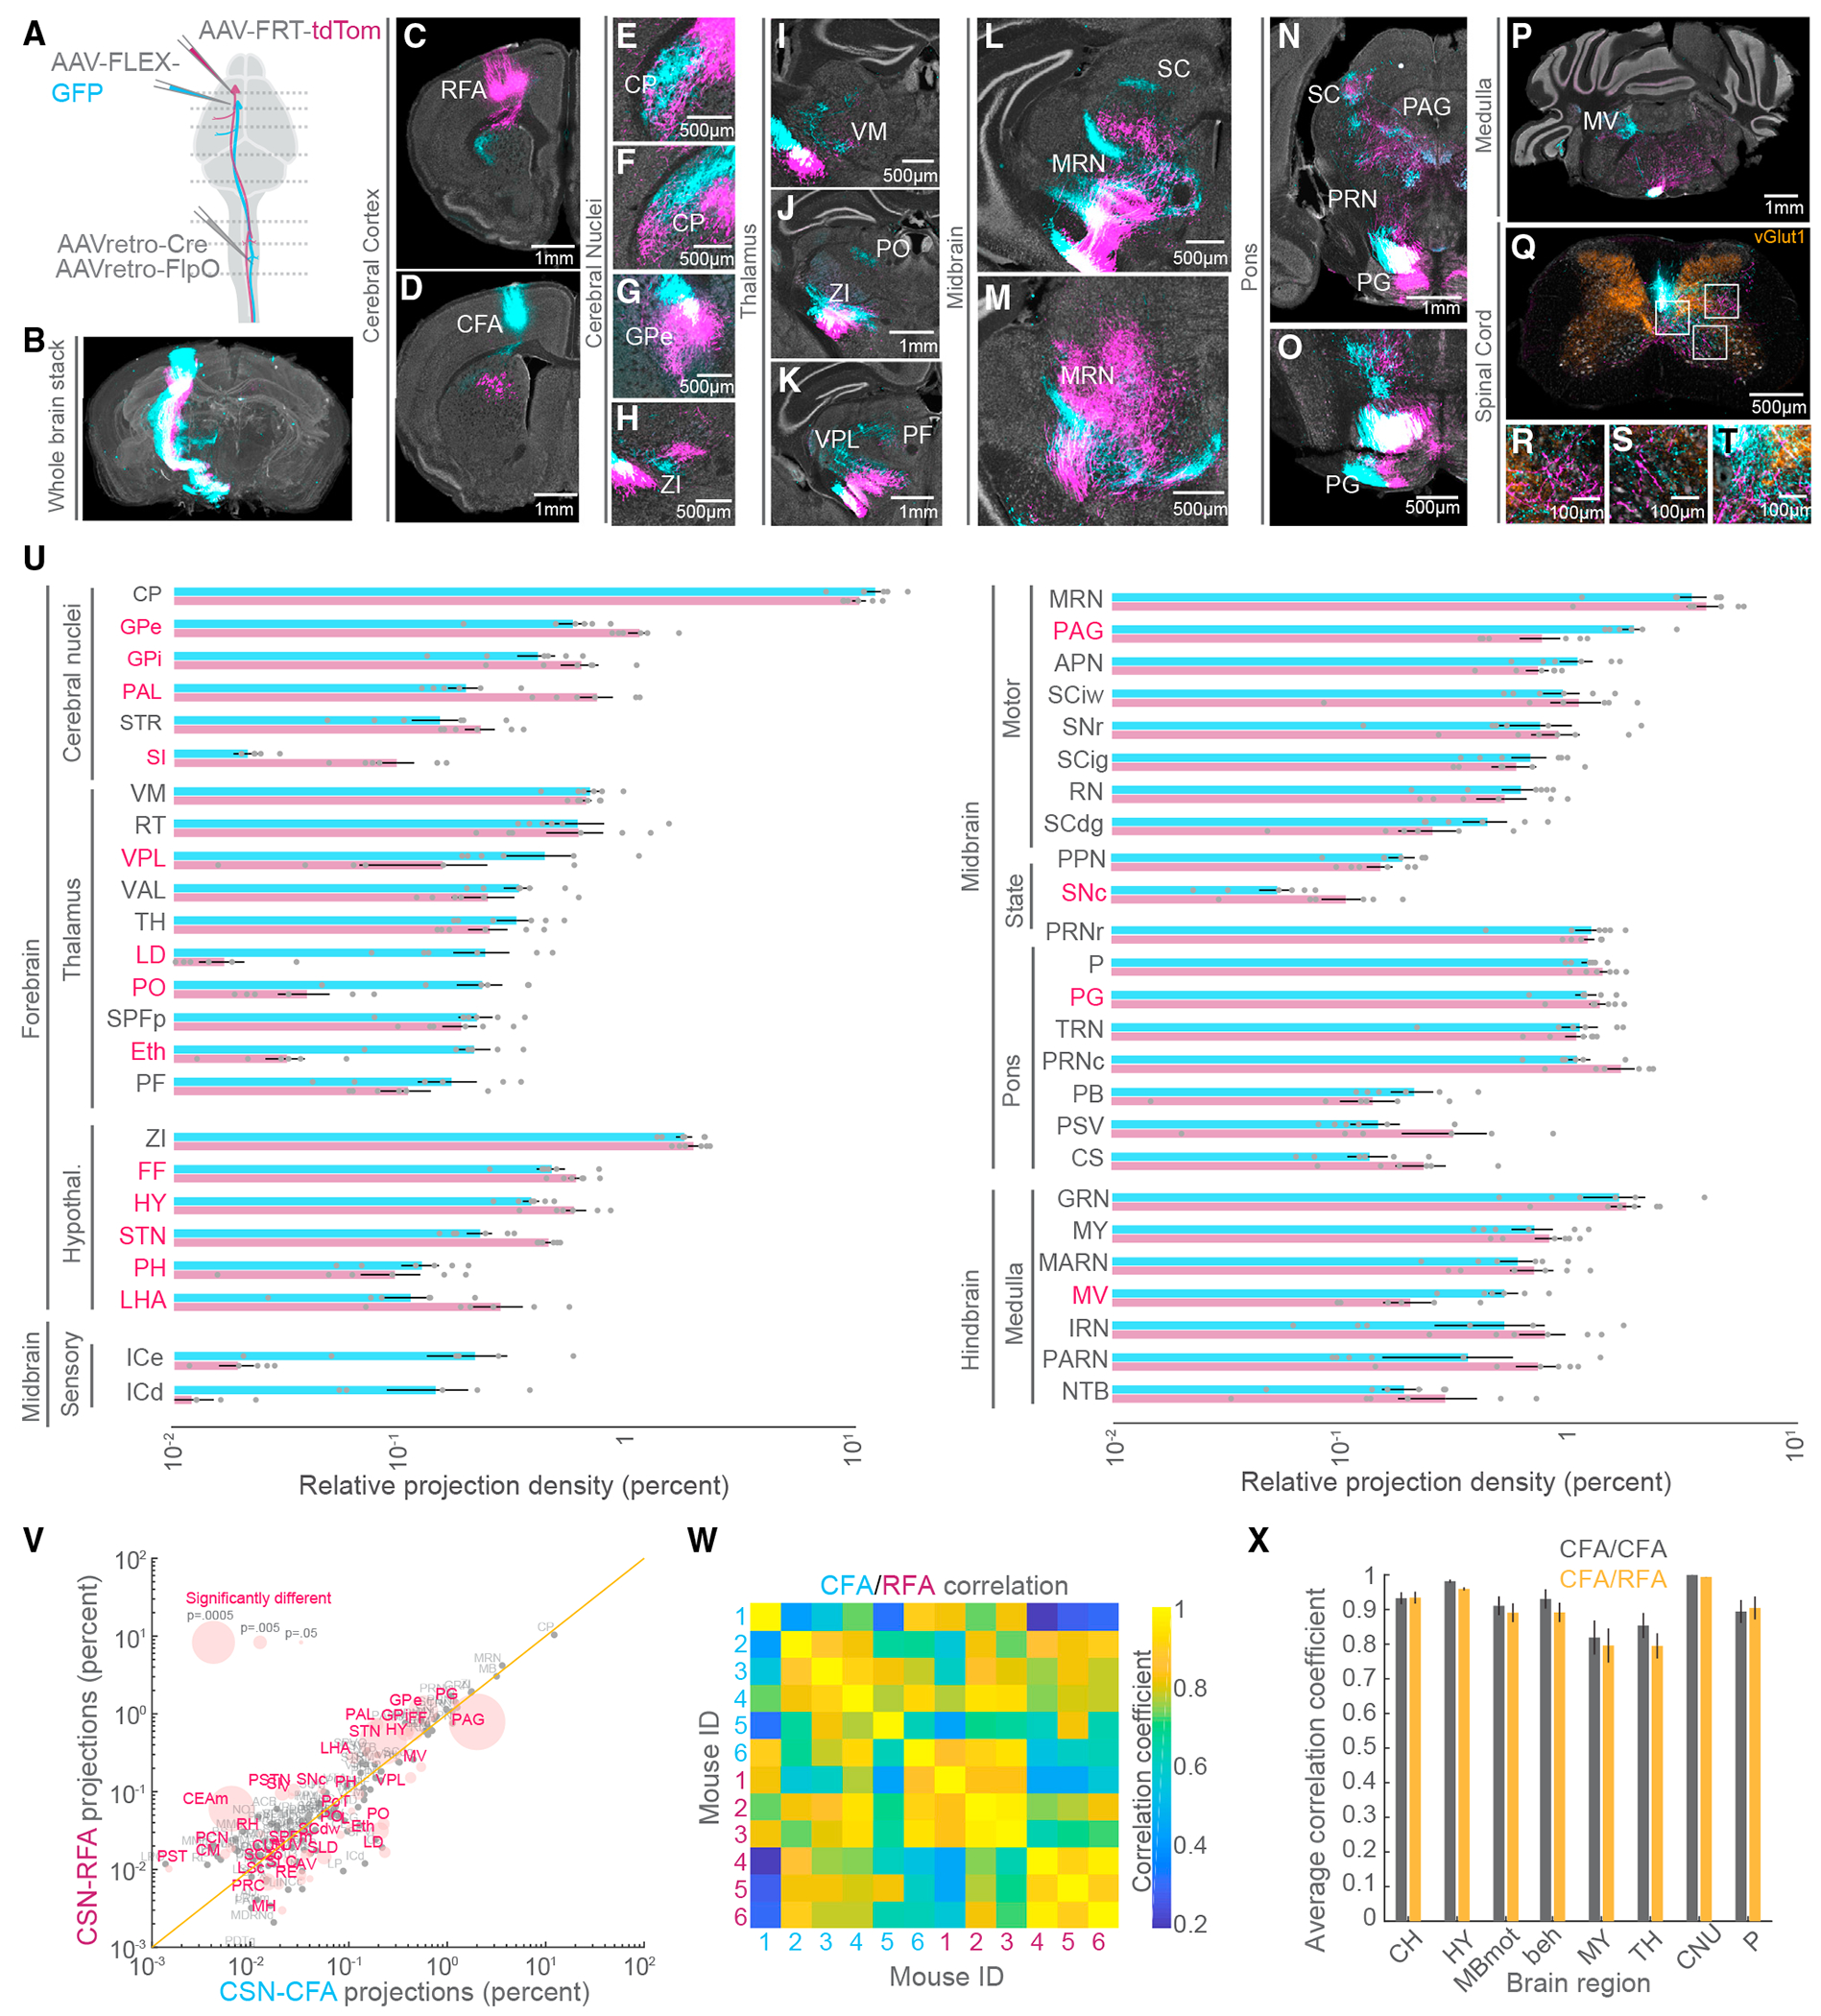
Figure 3. The supraspinal topography of CFA and RFA axon collaterals.

(A) Strategy to simultaneously label CFA and RFA CSNs.
(B) 3D reconstruction of a brain with CFA (cyan) and RFA (magenta) CSNs labeled (representative of N = 6 mice for B–T).
(C–T) Exemplar photomicrographs of CFA and RFA CSN labeling throughout the central nervous system. Select regions are indicated. In (Q)–(T), vGlut1 axonal boutons are immunolabeled and shown in orange.
(U) The brain regions that are targeted by CFA and RFA CSNs excluding isocortical structures (N = 6 mice for U–X). Regions are grouped by their ontology (see Table S3). Regions with significantly different fractions of CFA and RFA labeling are indicated in red. Note the log scale, given the large range of labeling.
(V) Scatterplot of regions containing CFA versus RFA projections. Regions with significantly different fractions of CFA and RFA labeling are colored red. The size of points corresponds to the p value of the comparison (paired t tests). Note the log scale, given the large range of labeling.
(W) Matrix depicting the correlation of labeling within and across all 6 mice. Quadrants correspond to CFA versus CFA (top left quadrant), RFA versus RFA (bottom right quadrant), or CFA versus RFA (bottom left and top right quadrants) labeling.
(X) The average correlation coefficients of CFA versus CFA (gray) labeling or CFA versus RFA labeling (orange) within major brain regions across all mice. CH, cerebrum; HY, hypothalamus; MBmot, motor midbrain; beh, behavioral-state-related midbrain; MY, medulla; TH, thalamus; CNU, cerebral nuclei; P, pons.
Refer to Table S3 for a complete list of the brain structures and their corresponding acronyms. Data are represented as mean ± SEM. Red text in (U) and (V): p < 0.05 See also Figure S4.
