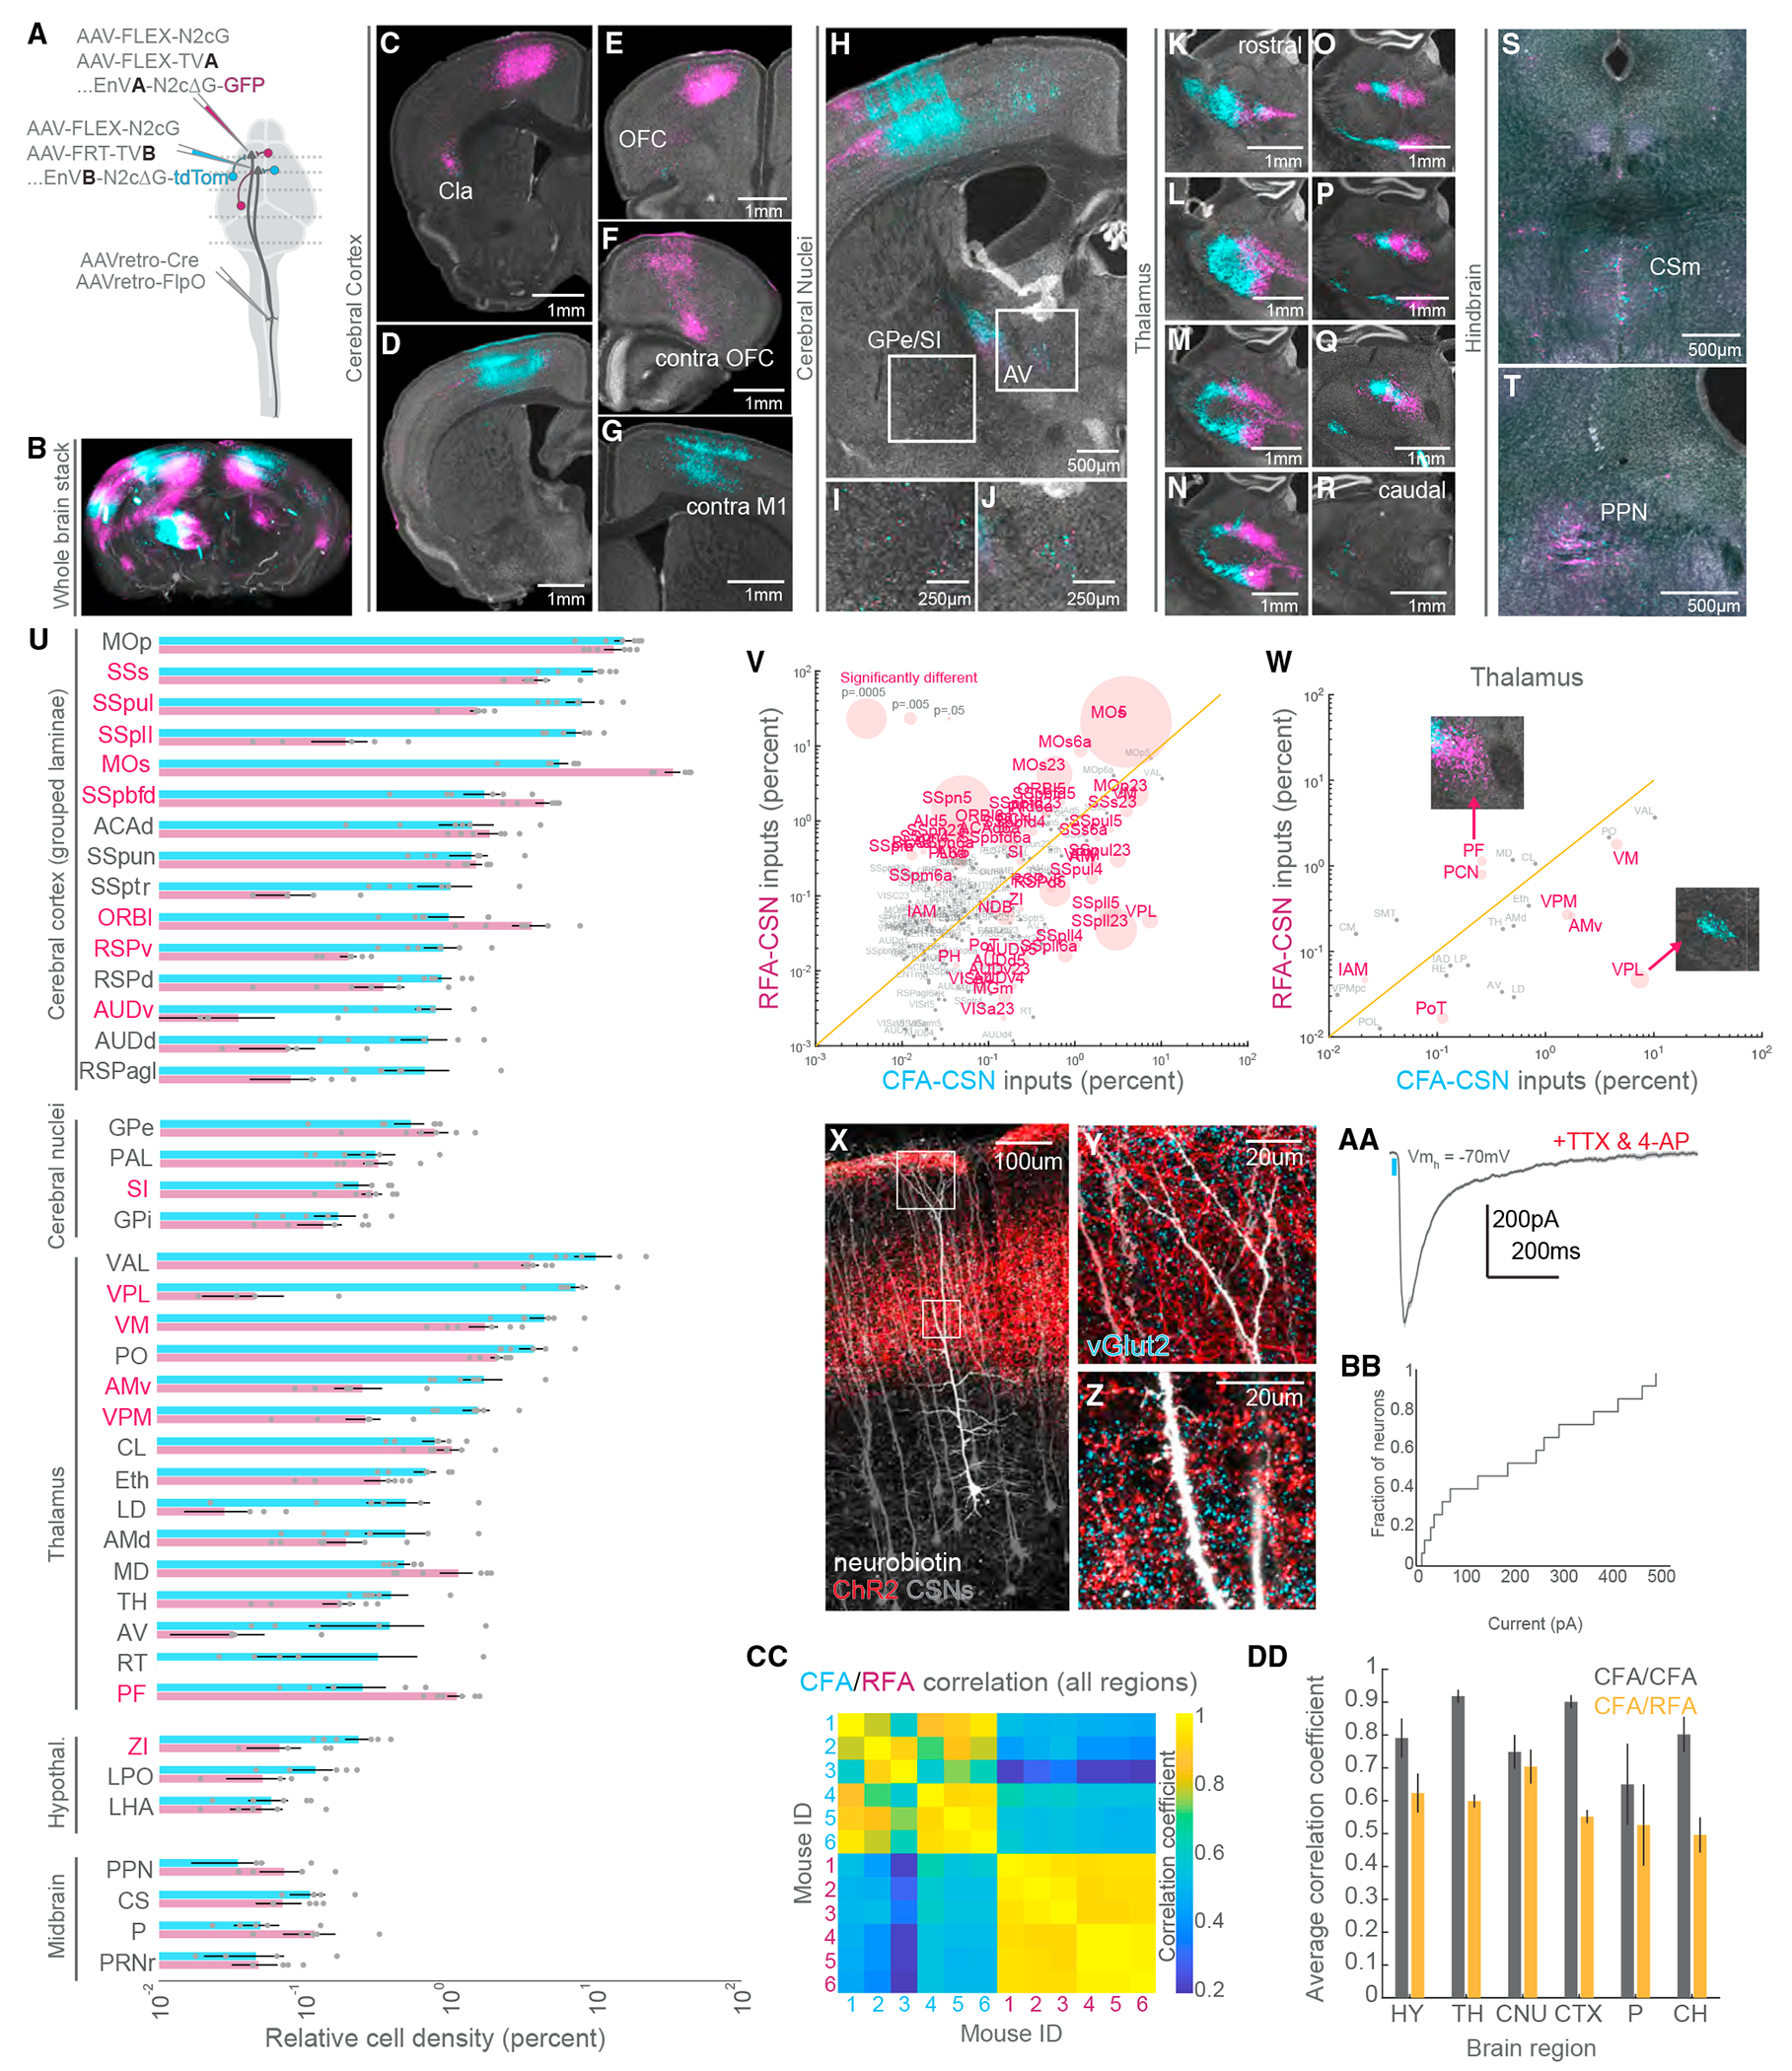
Figure 4. CFA and RFA CSNs are defined by unique brain-wide inputs.

(A) Strategy to simultaneously label brain-wide inputs to CFA and RFA CSNs.
(B) 3D reconstruction of a brain with inputs to CFA (cyan) and RFA (magenta) CSNs labeled (representative of N = 6 mice).
(C–T) Exemplar photomicrographs of inputs to CFA and RFA CSNs throughout the brain. Select regions are indicated (representative of N = 6 mice for B–T).
(U) The brain regions that give rise to neurons that synapse on CFA or RFA CSNs (N = 6 mice for U–W, CC, and DD). Regions are grouped by their ontology (see Table S3). Regions with significantly different fractions of input to CFA and RFA CSNs are indicated in red. Note the log scale, given the large range of labeling.
(V) Scatterplot of regions containing inputs to CFA versus RFA CSNs. Regions with significantly different fractions of CFA and RFA inputs are colored red. The size of points corresponds to the p value of the comparison (paired t tests). Note the log scale, given the large range of labeling.
(W) Same as (V) but only showing thalamic inputs. The insets are photomicrographs illustrating the biases in thalamic input to CFA or RFA CSNs.
(X) Photomicrograph illustrating CSNs (gray), thalamocortical axons (red), and a select CSN targeted for whole-cell intracellular recording (white, representative of N = 3 mice for X–Z).
(Y) An expanded view of the superficial boxed region from (X) depicting axons surrounding the apical dendrites of CSNs. Presynaptic terminals are labeled with vGlut2 (cyan).
(Z) An expanded view of the lower boxed region from (X) depicting axons surrounding the trunk dendrites of CSNs. Presynaptic terminals are labeled with vGlut2 (cyan).
(AA) Example average EPSC evoked through optogenetic stimulation of thalamocortical axons (blue bar). Recordings are made in TTX and 4AP to isolate monosynaptic transmission.
(BB) Cumulative distribution of the current evoked through stimulation of thalamocortical axons (N = 3 mice, n = 15 neurons for AA and BB).
(CC) Matrix depicting the correlation of input labeling within and across all 6 mice. Quadrants correspond to CFA versus CFA (top left quadrant), RFA versus RFA (bottom right quadrant), or CFA versus RFA (bottom left and top right quadrants) labeling.
(DD) The average correlation coefficients of inputs to CFA versus CFA (gray) or CFA versus RFA labeling (orange) within major brain regions across all mice.
Refer to Table S3 for a complete list of the brain structures and their corresponding acronyms. Data are represented as mean ± SEM. Red text in (U)–(W): p < 0.05 See also Figures S5–S7.
