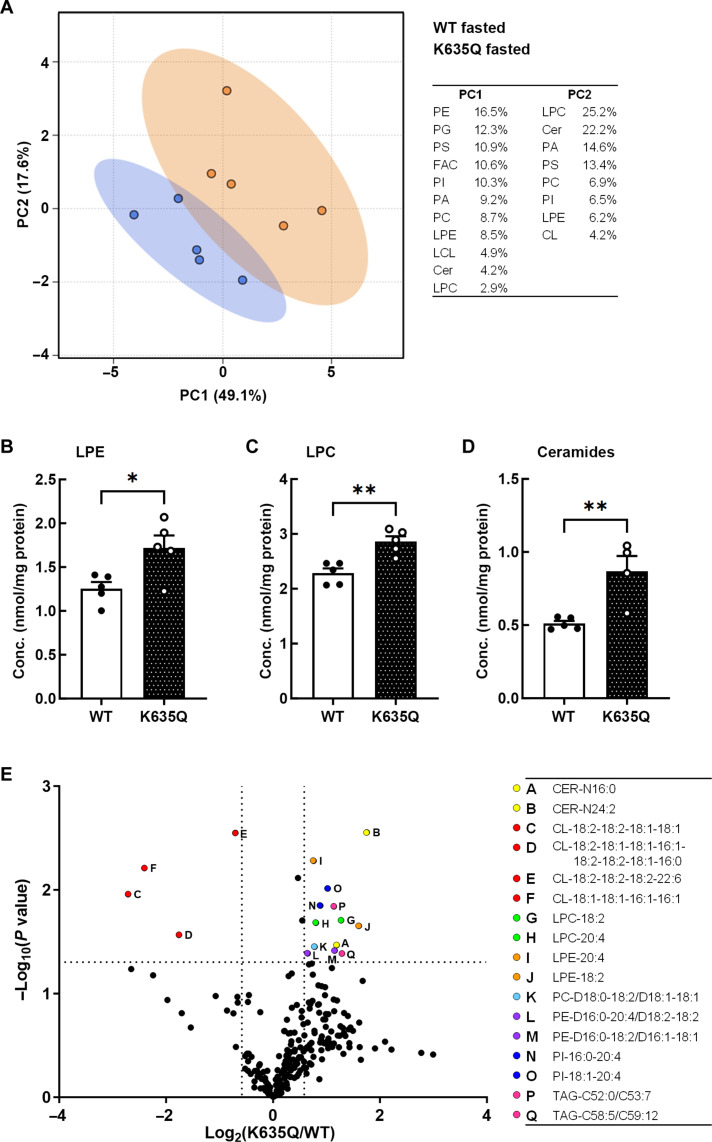
Fig. 7. Liver lipidomics comparing fasted wild-type and Acss1K635Q/K635Q mice.
(A) Principal components analysis (N = 5 mice per group). (B to D) LPE (B), LPC (C), and ceramides (D) are up-regulated 1.4-fold, 1.3-fold, and 1.7-fold, respectively, in fasted Acss1K635Q/K635Q mice compared to fasted wild-type mice. Data are represented as mean ± SEM. *P < 0.05 and **P < 0.01, calculated by two-tailed unpaired Student’s t tests. (E) Volcano plot showing the degree of differential regulation of specific lipid species. Cer, ceramide; CL, cardiolipin; FAC, fatty acyl chains; LCL, lysocardiolipin; LPC, lysophosphatidylcholine; LPE, lysophosphatidylethanolamine; PA, phosphatidic acid; PC, phosphatidylcholine; PE, phosphatidylethanolamine; PG, phosphatidylglycerol; PI, phosphatidylinositol; PS, phosphatidylserine; TAG, triacylglycerol.

