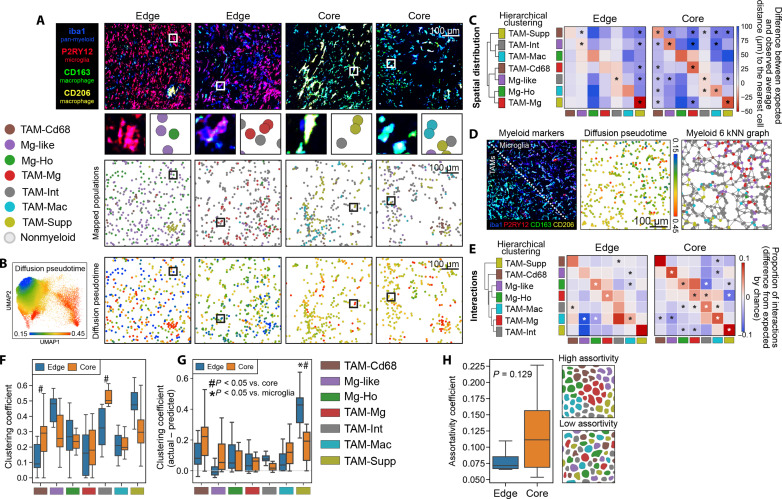
Fig. 2. Myeloid cells exhibit high homotypic and low heterotypic clustering behavior in GBM.
(A) Mapping of the myeloid populations identified from single-cell analyses to their locations in the TME in edge and core regions. (B) Diffusion pseudotime showing how differentiation away from a homeostatic microglial phenotype relates to myeloid cell positioning. (C) Spatial distribution analysis which shows whether populations are closer or further away from each other in the TME than would be expect by chance. (D) IMC image showing separation of microglia (P2RY12+) and macrophages (CD163+ and CD206+), alongside the position of the cells on the microglia-macrophage diffusion pseudotime axis, and how the cells are connected in the six–nearest neighbors (kNN) analyses. (E) Proportion of cellular interactions made by myeloid populations when each myeloid cell is connected to its six nearest neighbors. Hierarchical clustering of the interactions shows that cells with a similar phenotype also have similar proportions of interactions with other populations. (F) Clustering coefficient of the different populations in the edge and core of the tumor. (G) Correction of clustering coefficients for differences in cell abundance, in which a positive value suggests that cells are clustering at a greater rate than expected by chance. (H) Comparison of assortativity of myeloid populations in edge and core regions. Comparison made by Wilcoxon test with Benjamini-Hochberg correction (C and E), multiple linear regressions, corrected for multiple comparisons by Holm-Šídák (F and G), or Mann-Whitney U test (H). Box plots show range, interquartile range, and median of data (F to H).

