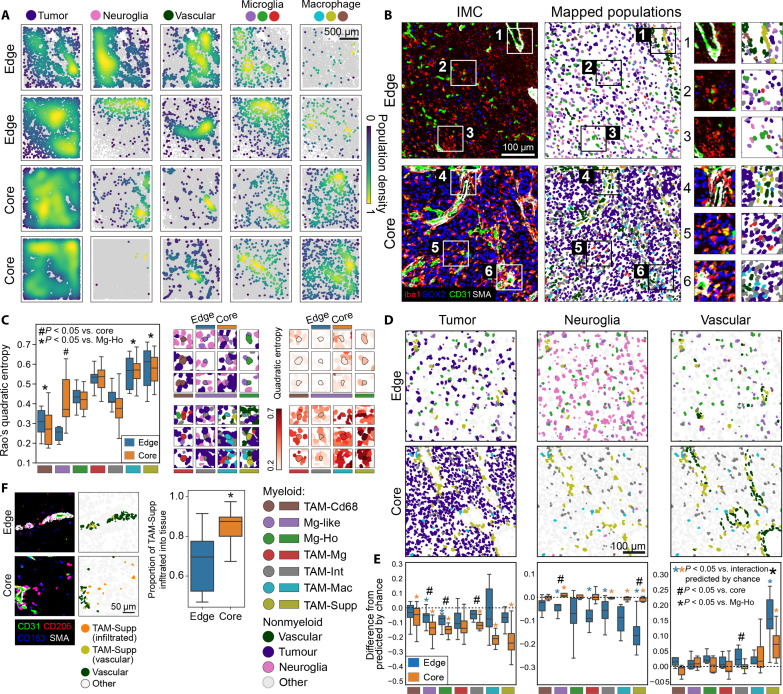
Fig. 3. Myeloid cell interactions with tumor, neuroglial, and vascular cells in GBM.
(A) Spatial density of different cell populations (calculated by Gaussian kernel density estimation) in the TME. (B) Myeloid cells mapped alongside tumor, neuroglial, and vascular cells in representative edge and core regions. (C) Quadratic entropy for the myeloid populations in the edge and core of the tumor. This quantifies how heterogeneous a cell is with respect to its interacting cell, with high values indicating that a cell interacts with several cells with different phenotypes. (D) Representative examples of myeloid populations mapped alongside nonmyeloid populations. (E) Difference between the observed rate of cell-to-cell interaction data (see fig. S3C) and the rate of interactions predicted by chance. This analysis corrects for the established differences in abundances of the myeloid and nonmyeloid cells between different regions. (F) Comparison between edge and core regions in the rate of infiltration of TAM-Supp cells into the parenchyma, defined here as being 10 μm away from nearest vascular cell. Comparisons made by linear mixed models (B, C, and E) or Wilcoxon tests (E) with Holm-Šídák corrections or Mann-Whitney U test (F). Box plots show range, interquartile range, and median of data (C, E, and F).

