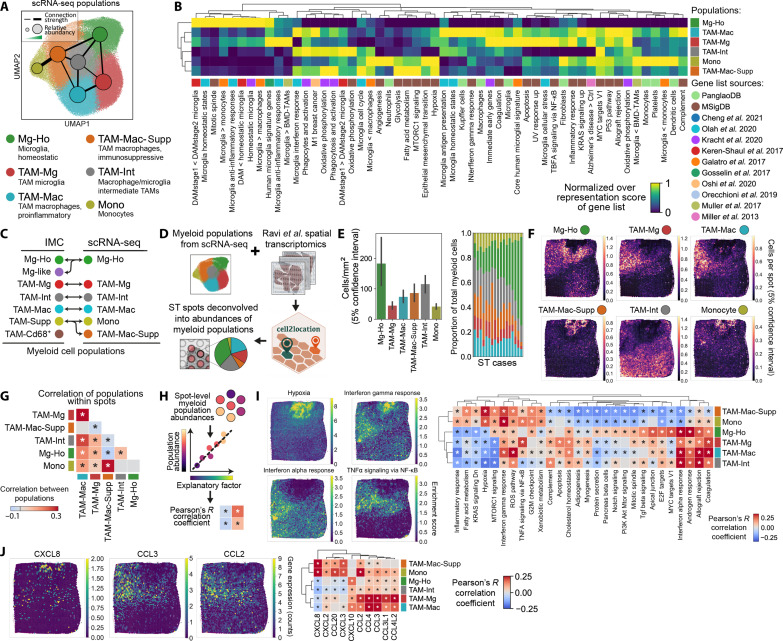
Fig. 5. ST reveals hypoxia and chemokines as determinants of myeloid cell positioning in GBM.
(A) UMAP of the myeloid populations identified by Leiden clustering in the Ruiz-Moreno et al. scRNA-seq dataset. (B) Comparison between the transcriptomes of the myeloid populations and published gene lists for biological processes (MSigDB) (79), cell identities (PanglaoDB) (80), myeloid cell phenotype in GBM, and other conditions disease (7, 70–78). Enrichment of the gene lists was calculated by overrepresentation analysis. (C) Alignment of the populations identified by IMC and scRNA-seq. (D) Schematic showing the strategy for deconvolving the Ravi et al. (37) ST datasets using the cell2location (82) and the transcriptomic signatures of the myeloid populations we identified in the Ruiz-Moreno et al. dataset (26). (E) Predicted abundances of the myeloid populations calculated using cell2location. Data shown as mean ± SEM. (F) Distribution of myeloid populations in ST spots within a representative deconvolved ST case. (G) Pearson’s R correlation between the different myeloid populations present in each spot. (H) Strategy for identifying explanatory factors that may control the positioning of myeloid cell populations. Using this strategy, myeloid cell abundances were correlated with the transcriptomic signatures of biological processes from the MSigDB database (I) or expression of chemokines (J). *P < 0.05, with correction for multiple Pearson’s R tests using the Benjamini-Hochberg procedure (G, I, and J). UV, ultraviolet; NF-κB, nuclear factor κB; TNFα, tumor necrosis factor–α; ROS, reactive oxygen species.

