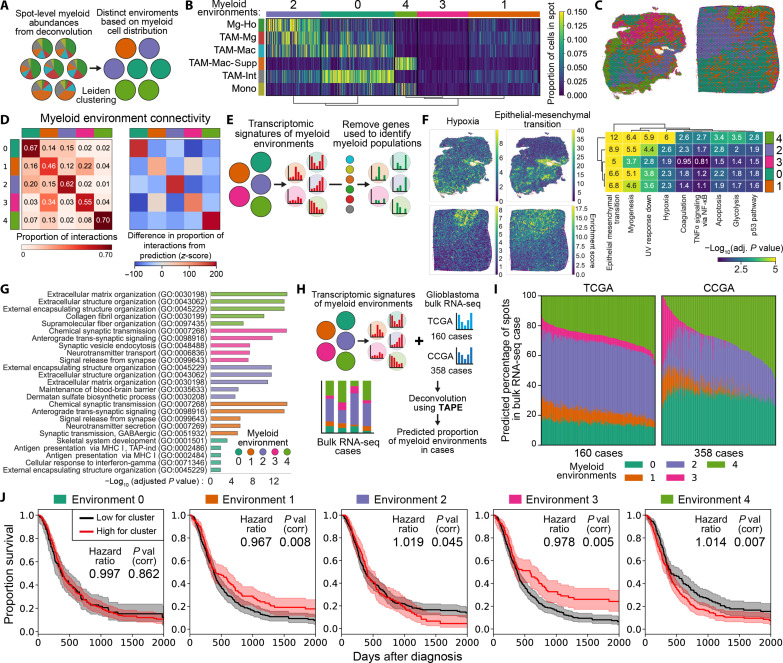
Fig. 6. Spatial clustering of myeloid cells is associated with poor outcome in GBM.
(A) Strategy to identify environments in the deconvolved ST cases that have distinct patterns of myeloid cell distribution. (B) Identification of distinct patterns of myeloid cell distribution using k-means clustering, corresponding to five distinct myeloid cell environments. (C) Mapping of the five myeloid environments in example ST cases. (D) Proportion of interactions between spots from each myeloid environment, assuming that each spot is connected to its neighboring six spots. (E) Strategy to identify the transcriptomic changes arising from the nonmyeloid cells in each spot (see Materials and Methods). (F) Overrepresentation analysis of the signatures of biological process from the MSigDB database (79) in the remaining nonmyeloid genes in the different myeloid environments. (G) The top five enriched terms from the Gene Ontology (GO) database in the nonmyeloid genes in the different myeloid environments. (H) Strategy to deconvolve bulk RNA-seq GBM cases from the TCGA (The Cancer Genome Atlas) and CCGA (Chinese Glioma Genome Atlas) using the TAPE algorithm (41–43), therefore allowing us to predict the proportions of myeloid environments in each case. (I) Proportion of myeloid environments predicted by the TAPE algorithm in the TCGA and CCGA cases. (J) Modeling the relationship between the abundance of each myeloid environment and GBM survival using Cox proportional hazards, with correction for multiple tests using Holm-Šídák. Hazard ratios are increase in risk of death per percentage point of myeloid environment abundance. Kaplan-Meier curves compare patients having the high (top 50%) or low estimates for the presence of that environment, and shaded areas are 95% confidence intervals.

