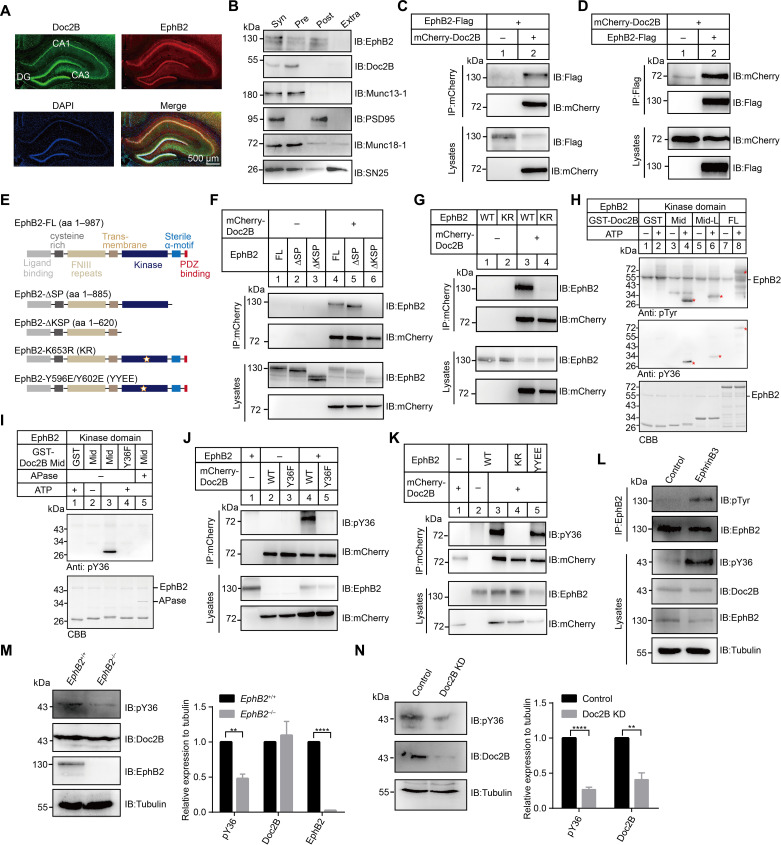
Fig. 3. Presynaptic EphB2 interacts with Doc2B and phosphorylates Doc2B at Y36.
(A) Immunostaining against Doc2B (green) and EphB2 (red) in the mouse hippocampus region. Nuclear DNA was labeled with 4′,6-diamidino-2-phenylindole (DAPI) (blue). Scale bars, 500 μm. (B) Separation of pre- and postsynaptic densities from purified synaptosomes. Syn, synaptosome; Pre, presynaptic elements; Post, postsynaptic elements; Extra, extrajunctional synaptic elements. (C and D) Western blot analysis of Doc2B-EphB2 interaction following cotransfection of mCherry-tagged Doc2B and Flag-tagged EphB2 in HEK293 cells. Cell lysates were immunoprecipitated by anti-mCherry antibody (C) or anti-Flag antibody (D), followed by immunoblotting with indicated antibody. (E) Schematic representation of EphB2 constructs. (F and G) Western blot analysis of Doc2B-EphB2 interaction following cotransfection of various combinations of plasmids containing EphB2 FL, EphB2-∆SP, EphB2-∆KSP, and/or mCherry-tagged Doc2B (F), EphB2 WT, KR, and/or mCherry-tagged Doc2B (G) in HEK293 cells. (H and I) In vitro phosphorylation assay using sumo-tagged EphB2 and GST-tagged Doc2B fragments (H) and GST-tagged Doc2B Mid or Y36F (I) in the presence or absence of ATP and APase. Asterisks show bands of GST-Doc2B Mid, Mid-L, and FL, respectively. CBB, Coomassie Brilliant Blue staining. (J and K) Western blot analysis of Doc2B phosphorylation following cotransfection of mCherry-tagged Doc2B WT or Y36F and/or EphB2 (J) and EphB2 WT, KR, or YYEE and/or mCherry-tagged Doc2B (K) in HEK293 cells. (L) Detection of Doc2B phosphorylation in cultured mouse cortex neurons by application of Fc (control) or preclustered Ephrin-B3-Fc. (M and N) Western blot analysis of Doc2B phosphorylation in EphB2+/+ or EphB2−/− mouse brains (M) in Doc2A-deficient neurons infected with Doc2B KD or control virus (N). Tubulin used as the reference protein. Data are presented as means ± SEM (n = 3). Statistical significance and P values were determined by Student’s t test (**P < 0.01; ****P < 0.0001).

