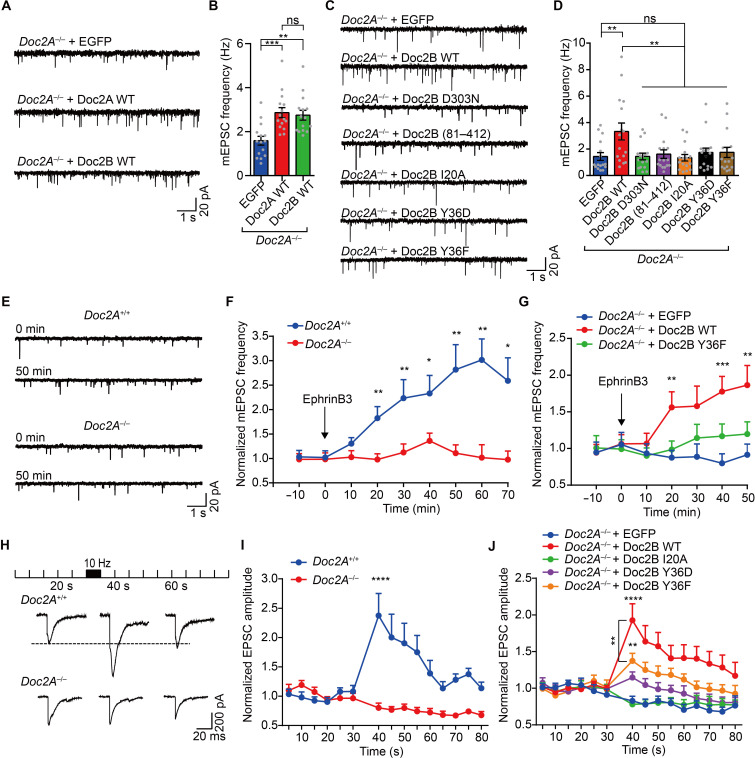
Fig. 5. EphrinB3-EphB2 signaling regulates spontaneous release and synaptic augmentation.
(A and B) Representative traces (A) and quantification of mEPSC frequency (B) in Doc2A−/− neurons (EGFP, n = 15; Doc2A WT, n = 15; Doc2B WT, n = 15). (C and D) Representative traces (C) and quantification of mEPSC frequency (D) in Doc2A−/− neurons expressing EGFP (n = 16), Doc2B WT (n = 16), Doc2B D303N (n = 16), Doc2B (81 to 412) (n = 16), or Doc2B I20A (n = 16). (E) Representative traces of mEPSC frequency in Doc2A+/+ (top) and Doc2A−/− (bottom) neurons after stimulation with EphrinB3. (F and G) Summary of the changes in mEPSC frequency after stimulation with EphrinB3 in Doc2A+/+ (n = 16) and Doc2A−/− (n = 18) neurons (F) and in Doc2A−/− neurons expressing EGFP (n = 16), Doc2B WT (n = 16), or Doc2B Y36F (n = 16) (G). Data were normalized to the average value during the control period before stimulation. (H) Representative traces of evoked EPSCs in synaptic augmentation at 20, 40, and 60 s in Doc2A+/+ and Doc2A−/− neurons. (I and J) Normalized peak amplitudes of evoked EPSCs in Doc2A+/+ (n = 20) and Doc2A−/− (n = 23) neurons (I) or in Doc2A−/− neurons expressing EGFP (n = 16), Doc2B WT (n = 16), Doc2B I20A (n = 17), Doc2B Y36D (n = 15), or Doc2B Y36F (n = 15) (J). Data are presented as means ± SEM. Recorded cells are from three independent experiments. Statistical significance and P values for (B), (D), (G), and (J) were determined by one-way ANOVA with Dunnett’s multiple comparison test, and those for (F) and (I) were determined by Student’s t test. *P < 0.05; **P < 0.01; ***P < 0.001; ****P < 0.0001.

