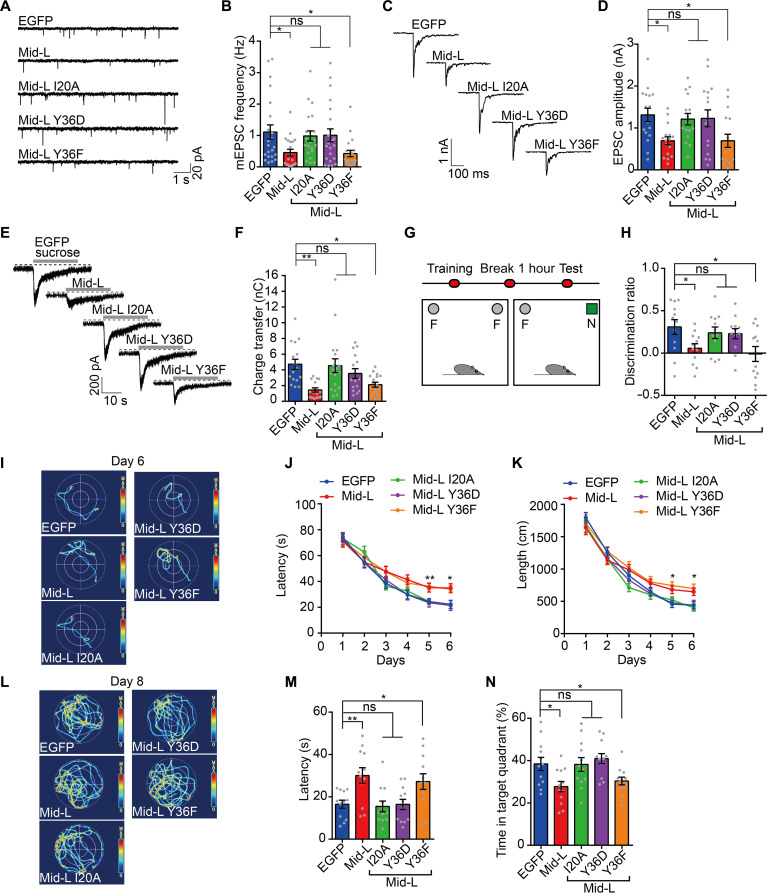
Fig. 6. Doc2-Munc13 interaction is critical for synaptic transmission and learning and memory.
(A and B) Representative traces (A) and quantification of mEPSC frequency (B) in WT neurons expressing EGFP (n = 22), Mid-L (n = 20), Mid-L I20A (n = 21), Mid-L Y36D (n = 22), or Mid-L Y36F (n = 20). (C and D) Representative traces (C) and quantification of AP-evoked EPSC amplitude (D) in WT neurons expressing EGFP (n = 16), Mid-L (n = 16), Mid-L I20A (n = 16), Mid-L Y36D (n = 16), or Mid-L Y36F (n = 16). (E and F) Representative traces (E) and quantification of EPSCs evoked by 0.5 M sucrose (F) in WT neurons expressing EGFP (n = 16), Mid-L (n = 15), Mid-L I20A (n = 18), Mid-L Y36D (n = 15), or Mid-L Y36F (n = 17). (G and H) Schematic representation of the novel object recognition task (G) and quantification of the discrimination ratio of time (H). F, familiar object; N, novel object. (I) Representative hotspots of path tracings taken from training session at day 6 in Morris water maze test. (J and K) Average latency (J) and swim length (K) to reach a hidden platform plotted against the blocks of trials (days). (L) Representative hotspots of path tracings taken from the probe trial at day 8. (M and N) Quantification of the latency to reach the previously hidden platform area (M) and percentage of time spent in the target quadrant (N) on day 8. Data are presented as means ± SEM. For electrophysiological recordings, cells are from three independent experiments. For behavioral tests, 12 mice per group. Statistical significance and P values were determined by one-way ANOVA with Dunnett’s multiple comparison test (*P < 0.05; **P < 0.01).

