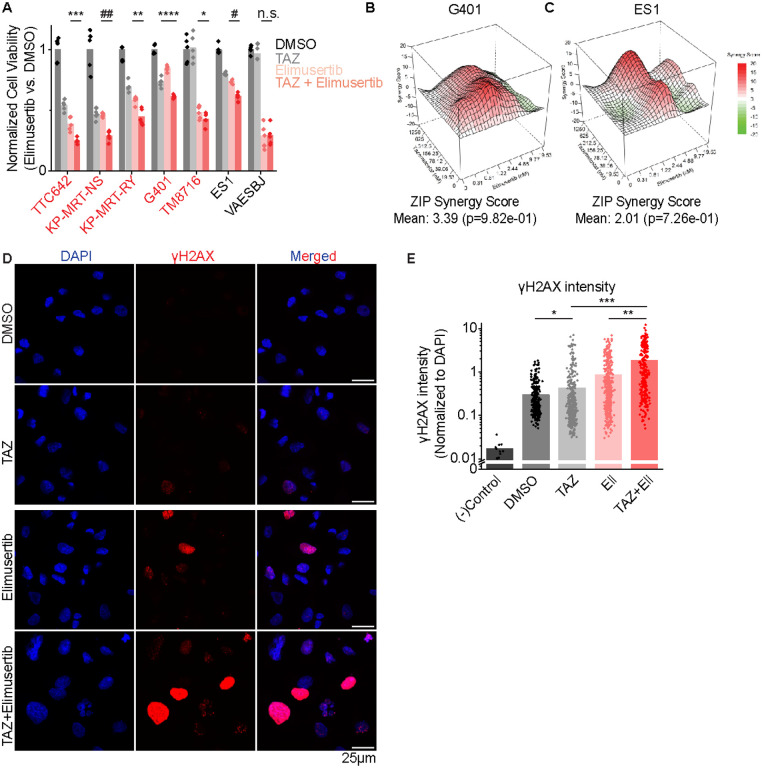
Figure 2: Combination EZH2 and ATR inhibition improves response in vitro:
(A) Panel of MRT and ES cell lines ordered left to right by decreasing response to TAZ monotherapy. Cells were treated with the indicated monotherapy or combination for 11 days. Drug concentrations used were: TAZ: 200 nM, elimusertib: 8 nM. We selected an elimusertib dose below its monotherapy IC50 (for G401 cells) in order to visualize any additive effects upon combination with TAZ. *p = 0.14, **p = 3.3E-3, ***p = 1.0E-3, ****p = 2.6E-4, #p = 6.1E-5, ##p = 3.0E-5 by two-sided Student’s t-test. All comparisons refer to TAZ + elimusertib vs. elimusertib conditions, except for G401 cells, in which comparison is for TAZ + elimusertib vs. TAZ. n = 5 replicates per condition. (B-C) Synergy plots for combination treatment with TAZ (left axis) and elimusertib (right axis) for (B) G401 and (C) ES1 cells. Cells were treated at the indicated doses for 9 days and analyzed for synergy using the Zero Interaction Potency (ZIP) model. (D) Representative images of G401 cells treated with the indicated treatment for 7 days. Elimusertib was added on Day 5. Doses used were 500 mM TAZ and 100 nM elimusertib. (E) Quantification of γH2AX fluorescence relative to DAPI fluorescence. *p = 9.3E-3, **p = 6.2E-14, ***p = 1.5E-29 by two-sided Student’s t-test. n = 332 nuclei for DMSO, 404 for TAZ, 400 for elimusertib, 257 for TAZ + elimusertib.

