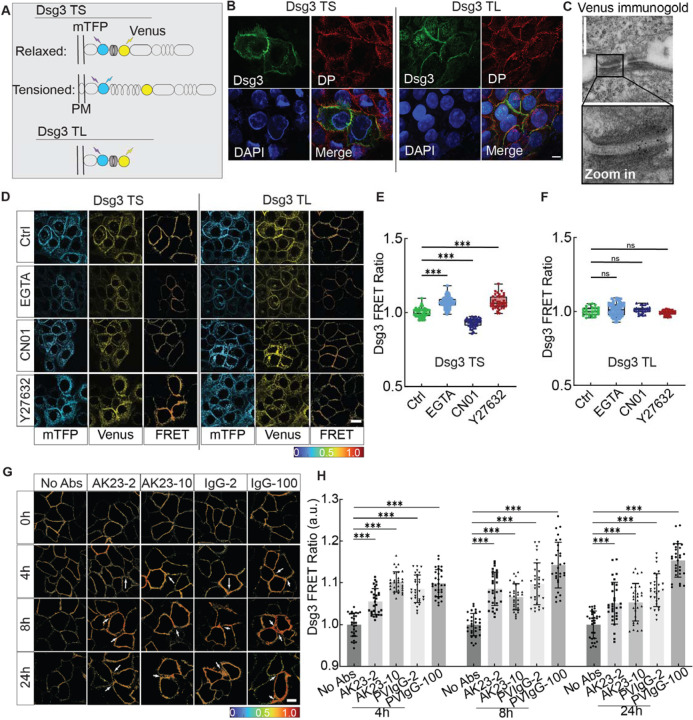
Figure 2. Dsg3 in response to inter- and intra-cellular force changes.
(A) Schematic diagram of Dsg3 tension sensor (TS) and tailless control sensor (TL). TSMod was inserted into the intracellular domain of Dsg3. (B) Immunostaining images of desmoplakin (DP) for HaCaT cells expressing Dsg3 TS or TL. Cells were immunostained for DP to check for the co-expression with sensors and nuclei were labeled with DAPI. Scale bar: 10 μm. (C) Immunogold image for HaCaT cells expressing the Dsg3 tension sensor. Positive signals were observed at desmosomes, suggesting that Dsg3 tension sensors incorporated into desmosomal cadherins. Scale bar: 500 nm. (D) Fluorescent images of donor (mTFP) and acceptor (Venus) and heatmap images of FRET ratio when Dsg3 TS/Dsg3 TL expressed HaCaT cells were exposed to EGTA for 30 min, 5 mM RhoA activator (CN01) for 30 min, ROCK inhibitor (Y27632) for 12h. Scale bar: 10 μm. (E, F) Quantitative analysis of FRET ratio shown in D. (G) Heatmap images of FRET ratio in HaCaT cells treated with the following conditions: untreated control (No Abs), 2 μg/mL AK23 (AK23–2), 10 μg/mL AK23 (AK23–10), 2 μg/mL PVIgG (PVIgG-2) and 100 μg/mL PVIgG (PVIgG-100) at 0h, 4h, 8h, and 24h. Scale bar: 10 μm. (H) Quantitative analysis of corresponding FRET ratio. All values are mean ± SD (n≥30). * p<0.05, ** p<0.01, *** p<0.005, ns, p>0.05. Three repeats for all conditions.

