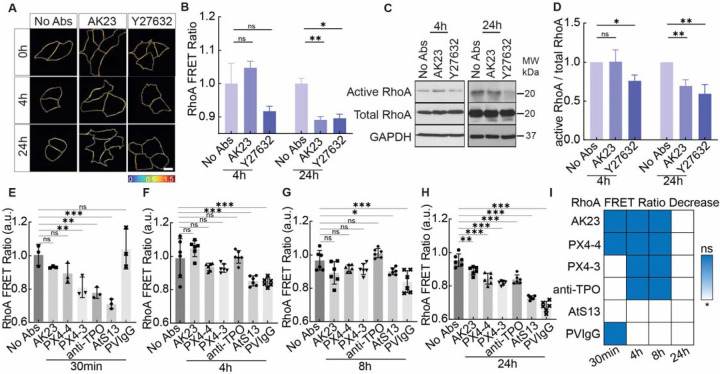
Figure 4. PV Ab-induced tension loss at Dsg3 inhibits RhoA.
(A, B) Heatmap images and quantitative analysis of RhoA FRET ratio show the activities of active RhoA in response to 2 μg/mL AK23 and 10 μM Y27632 at 4h and 24h. All values are mean ± SD (n≥30). (C, D) Corresponding western blot results. All values are mean ± SD (n≥3). (E-H) RhoA FRET ratio in HaCaT cells exposed to 2 μg/mL of AK23, PX4–4, PX4–3, anti-TPO, AtS13, and PVIgG at 30 min, 4h, 8h, and 24h. All values are mean ± SD (n≥30). (I) Summary of the significance of RhoA FRET ratio change over 24h for the Abs tested (blue = no change, white = significant decrease). * p<0.05, ** p<0.01, *** p<0.005, ns, p>0.05. Scale bar: 10 μm. Three repeats for all conditions.

