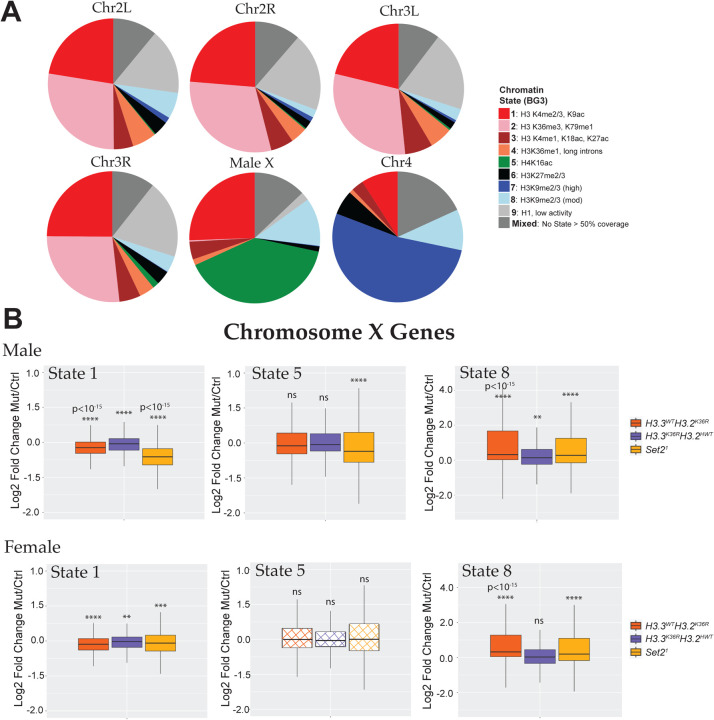
Fig. 4. Chromosome X genes with Different Predominant Chromatin States Respond Differently to Set2 and H3K36R mutation.
(A) Pie charts depicting predominant chromatin states (defined in [62]) of six Drosophila chromosomes in BG3 cells. BEDtools was used to assign genes to a predominant chromatin state. Genes were binned to a given state if > 50% of the gene was marked by that state. Genes where no state color was > 50% of gene length were designated as “Mixed”. Representative histone marks in each state depicted in the legend. A full characterization of each state is described in the source publication [62]. (B) Log2 Fold-change values of mutant genotypes described in Fig. S5 for ChrX genes were plotted separately for genes in the three predominant states on the male X: states 1 (n=499), 5 (n=798), and 8 (n=239). Statistical significance of difference between medians was assessed using the Wilcoxon signed rank test, followed by theBenjamini-Hochberg False Discovery Rate (FDR) correction for multiple comparisons. **P < 0.001. ***P < 0.001. ****P < 0.0001. ns, not significant.

