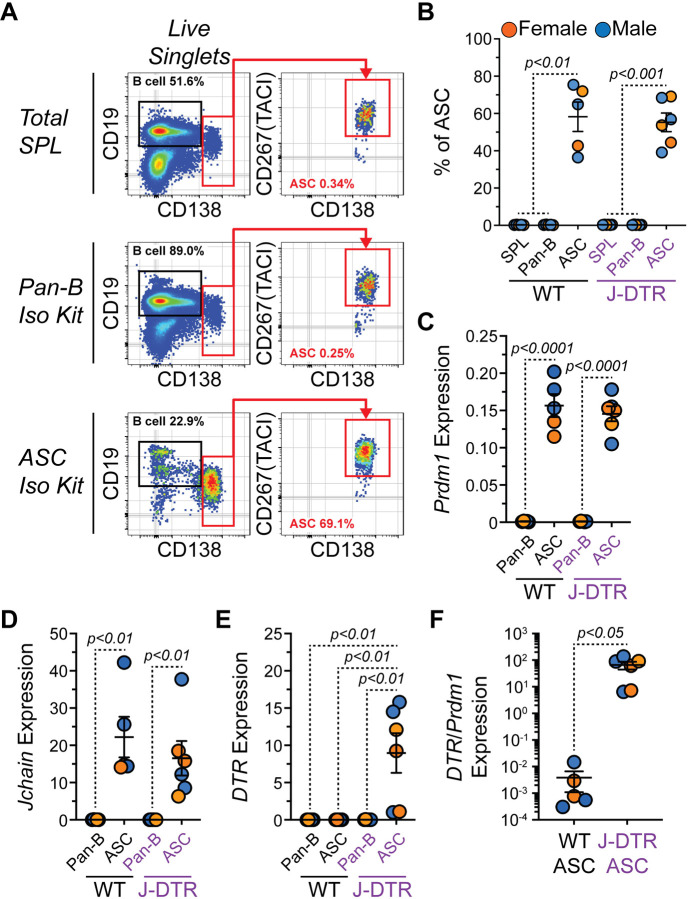
Figure 2: Validation of DTR gene expression by ASCs from J-DTR mice.
(A) Representative flow cytometry pseudocolor plots showing gating of CD19+ CD138−/LO B cells and CD138HI CD267(TACI)+ ASCs in total SPL or cells purified with STEMCELL Technologies Pan-B and CD138 (ASC) isolation kits. Numbers in plots indicate percentages of gated populations within total live singlets. (B) Quantification of ASC percentages in total SPL or purified cells using Pan-B and ASC isolation kits. (C-E) Relative gene expression of (C) Prdm1, (D) Jchain and (E) DTR (HBEGF) in cells purified using Pan-B and ASC isolation kits. All values are relative to the expression of Actb. (F) DTR expression normalized to Prdm1 expression in WT and J-DTR ASCs. (B-F) Symbols represent individual 3–7 months old female (orange) and male (blue) mice. Horizontal lines represent mean ± standard error of the mean (SEM). WT SPL, Pan-B and ASC: female n = 2, male n = 3; J-DTR SPL, Pan-B and ASC: female n = 3, male n = 3. Statistics: (B) One-way ANOVA with Dunnett’s multiple comparisons test with ASCs for each genotype set as the control column. (C-F) Unpaired Student’s t-test.

