
Figure 4: Single dose administration of DT leads to the acute depletion of ASCs in J-DTR mice. Related to Figure S3.
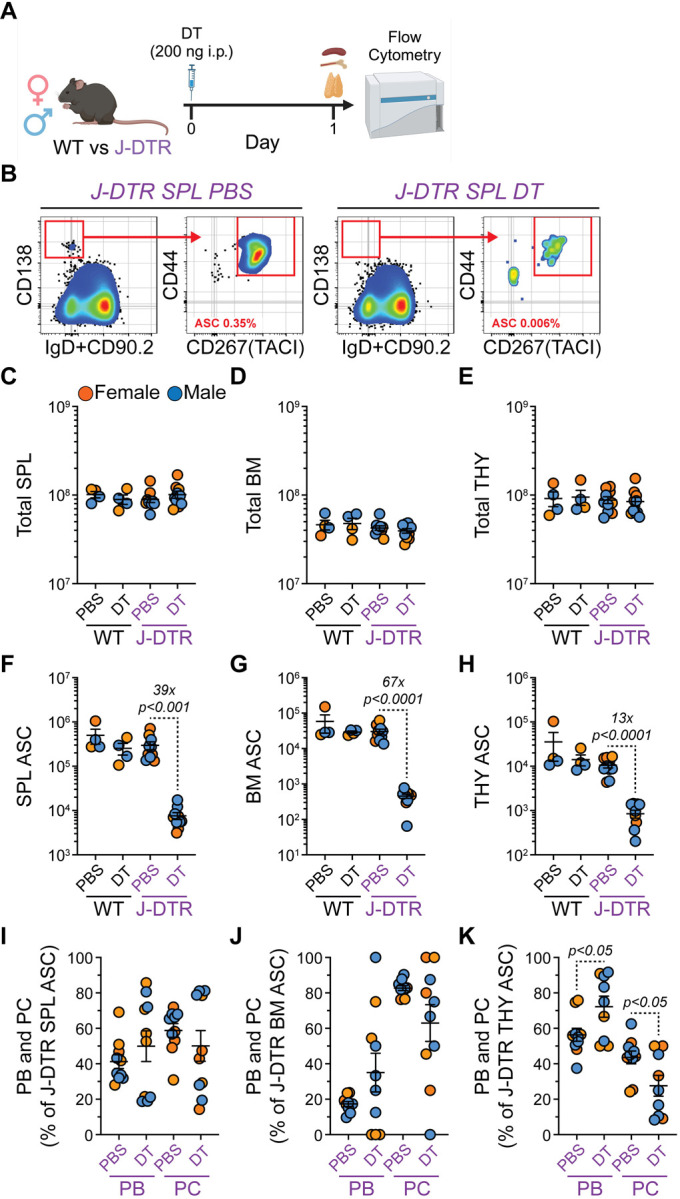
(A) Schematic showing DT treatment of WT and J-DTR mice. 3–4 months old animals were given a single i.p. dose of 200 ng DT in 100 μL 1x PBS. Control mice received 100 μL of 1x PBS. Mice were euthanized after 1 day and SPL, BM and THY were assessed for ASCs and other B cell populations via flow cytometry. Schematic made with BioRender. (B) Representative flow cytometry pseudocolor plots showing gating of SPL ASCs from J-DTR mice treated with PBS or DT. Cells were initially gated on live singlets and numbers in plots indicate percentages of ASCs within total live singlets. (C-E) Total cell numbers for (C) SPL, (D) BM and (E) THY of WT and J-DTR mice treated with PBS or DT. Data presented on Log10 scale to show full range. (F-H) Total ASC numbers for (F) SPL, (G) BM and (H) THY of WT and J-DTR mice treated with PBS or DT. Data presented on Log10 scale to show full range. (I-K) Percentages of PBs and PCs within ASC populations from (I) SPL, (J) BM and (K) THY of J-DTR mice treated with PBS or DT. (C-K) Symbols represent individual female (orange) and male (blue) mice. Horizontal lines represent mean ± SEM. WT PBS and DT: female n = 2, male n = 2; J-DTR PBS and DT: female n = 5, male n = 5. Statistics: (C-H) Unpaired Student’s t-test with comparisons made between PBS and DT treatments within a genotype. (I-K) Unpaired Student’s t-test with comparisons made between PBS and DT treatments within an ASC subset.