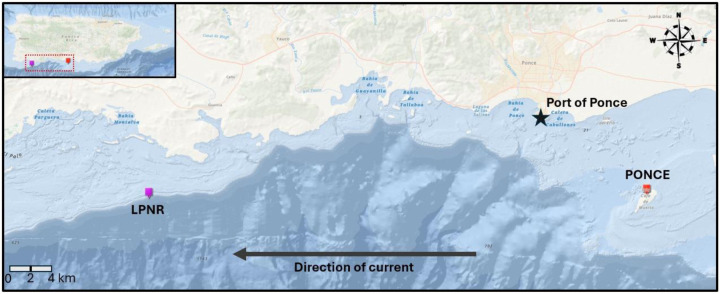
Figure 2:
Map showing southwest Puerto Rico sampling region with the locations of the colonies sampled in the LPNR (purple) and Ponce (red). The black arrow depicts the direction of the water current in the area. This figure shows a visual representation of how distant both study sites are from each other (approximated distance in km shown in Table 1).

