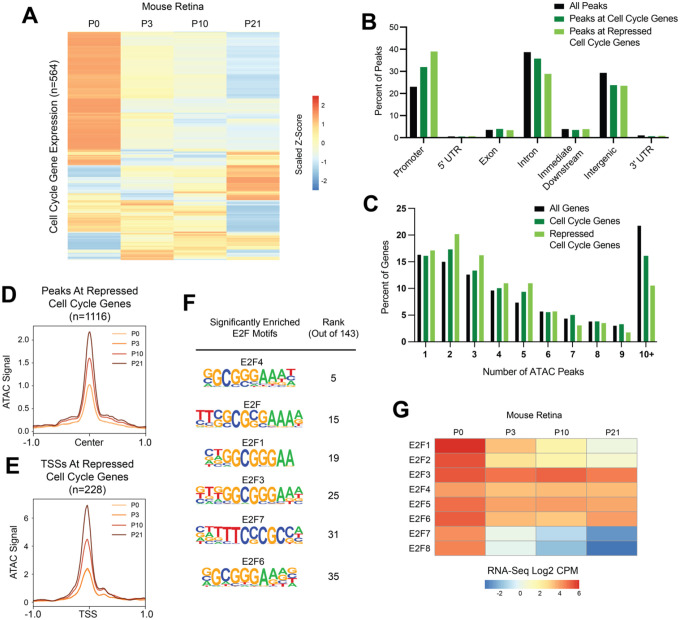
Figure 9: Many cell cycle genes in mouse retina have simpler than average regulatory architecture, are transcriptionally repressed after cell cycle exit, but retain chromatin accessibility during terminal differentiation.
(A) Heatmap depicting the average transcript expression values for 564 genes with annotated functions related to the cell cycle. Data are scaled by Z-score and hierarchically clustered. (B) Bar plot showing the genomic distributions of ATAC-Seq peaks from the mouse retina, either for all peaks (black bars), peaks associated with cell cycle genes (dark green bars), or peaks associated with repressed cell cycle genes (light green bars) (C) Bar plot showing the distributions of genes binned by number of ATAC-Seq peaks annotated to the gene. Data is shown from the mouse retina for all genes (black bars), cell cycle genes (dark green bars), or repressed cell cycle genes (light green). (D) Line plot showing average ATAC-Seq signal at peaks (+/− 1 kilobase from peak center) associated with the repressed cell cycle genes. P0, light orange. P3, orange. P10, dark orange. P21, brown. (E) Line plot showing average ATAC-Seq signal at TSSs (+/− 1 kilobase) for continually decreasing cell cycle genes. P0, light orange. P3, orange. P10, dark orange. P21, brown. (F) Enrichment of E2F motifs in peaks associated with repressed cell cycle genes. Table includes motif name and position weight matrix (PWM) and rank among the 143 motifs that were significantly enriched. (G) Heatmap depicting the average transcript expression values for E2F family genes. Data are presented as normalized Log2 Count Per Million (CPM) values.

