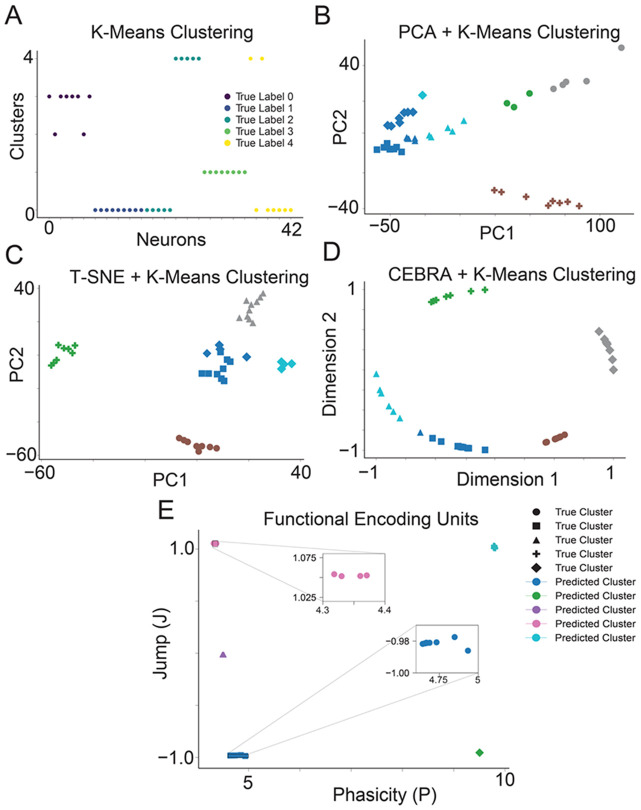
Figure 2. FEU analysis clusters simulated data more accurately than other methods.
A. We applied K-Means to cluster simulated neuron spike data. Data points correspond to individual neurons; the y-axis ‘Clusters’ denotes each neuron’s cluster assignments determined by K-Means, with colors indicating the neurons’ true clusters. Perfect clustering is achieved when neurons within the same predicted cluster share identical colors, reflecting accurate alignment with their true cluster.
B. We performed dimensionality reduction on the simulated neuron spike data with PCA and clustered the resulting principal components with K-Means. Data points correspond to individual neurons. The data point shape denotes the ground truth cluster assignment, while colors denote the predicted clusters. Perfect clustering is achieved when data points in clusters have the same color and shape.
C. We conducted dimensionality reduction on the simulated neuronal spike data using T-SNE, followed by clustering the derived principal components with K-Means. Each data point represents an individual neuron, with the shape of the data point indicating the neuron's actual cluster assignment and colors representing the predicted clusters. Perfect clustering is achieved when data points in clusters have the same color and shape.
D. We performed dimensionality reduction on the simulated neuronal spike data utilizing CEBRA and subsequently clustered the resultant components with K-Means. Each data point signifies an individual neuron; data point shape denotes the ground truth cluster assignment, while colors denote the predicted clusters. Perfect clustering is achieved when data points in clusters have the same color and shape.
E. FED representation of the simulated neuron spike data. We use FEU analysis to cluster the simulated neuron spike data. Perfect clustering is achieved when data points in each cluster have the same color and shape. Callout to show overlapping data points in a cluster.

