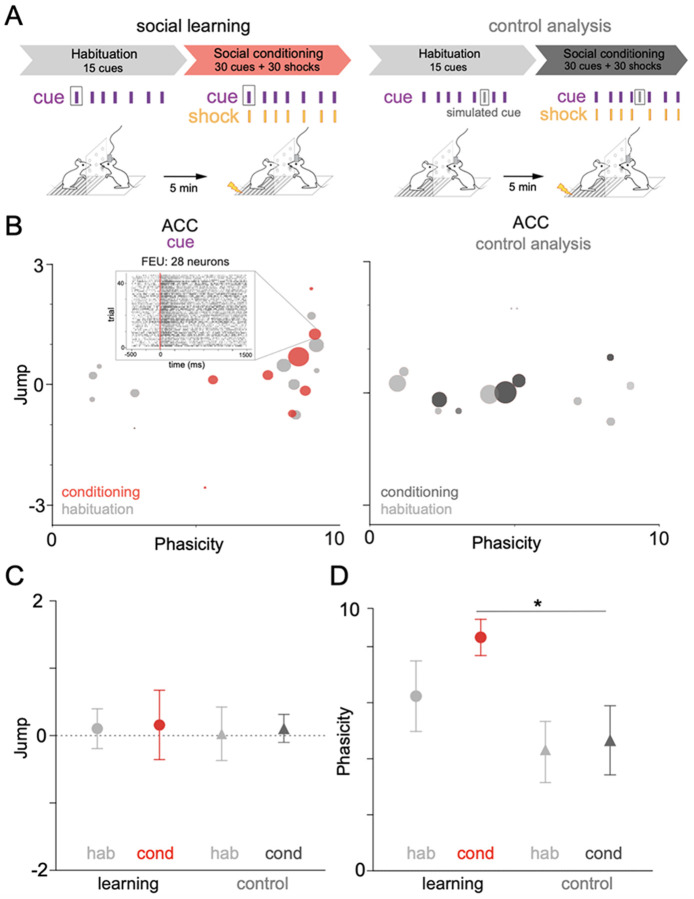
Figure 5. FEU representations capture changes in neural activity that occur with social learning.
A. We applied FEU analysis to the same social conditioning paradigm while including a habituation period in which cues were not predictive of shock delivery. We could then compare neural responses during habituation to those during social conditioning when cues predict shock delivery to the demonstrator. To test whether FED representations capture information about the cue, we included a control condition in which the pipeline received a false cue input (control analysis).
B. 2-D graphical FED representation of ACC cue FEU activity during habituation and conditioning periods of rodent social learning (left). Control analysis showing a FED representation of the false cue during habituation and conditioning (right). Call out to raster of selected FEU with 28 neurons and an excited-phasic cue response during social conditioning. See Table 1 for FED values.
C. Average cue Jump of all ACC FEUs during habituation and conditioning of social learning. No significant difference was found between the average ACC cue Jump during habituation and conditioning (Welch’s ANOVA; W (DFn, DFd) = 0.01439 (3.000, 15.86) p= 0.9975).
D. Average cue Phasicity parameter of all ACC FEUs during habituation and conditioning of social learning. There is a significant difference between FEU cue Phasicity during conditioning when compared to the control condition (Welch’s ANOVA; W (DFn, DFd) = 4.092 (3.000, 13.82), *p< 0.0283, Dunnett’s post-test, learning-cond vs control cond, *p = 0.0385).

