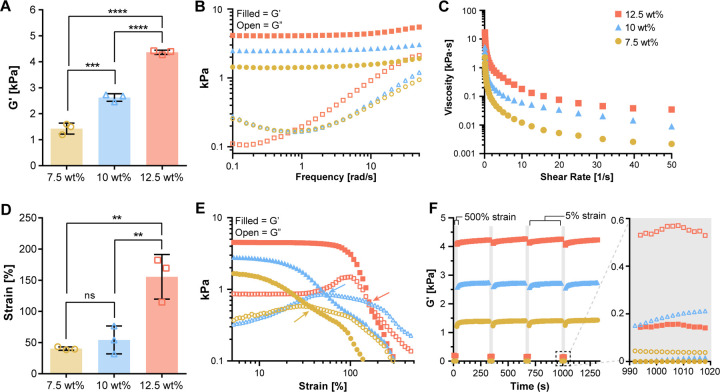
Fig. 2. Viscoelastic properties of PhoCoil gels.
(A) G’ determined from oscillatory rheology time sweeps at 25 °C, 5% strain, 10 rad s−1 with varied gel weight percentage. (B) A representative frequency sweep test at 25 °C with fixed 5% strain. (C) A representative viscosity profile during shear-sweep test at 25 °C. (D-E) Strain-sweep test at 25 °C with fixed 10 rad s−1 frequency. Panel D shows the strain crossover value indicated by the arrows in each selected representative strain sweep shown in Panel E. (F) Cyclic strain sweep test at 25 °C. Frequency was fixed at 10 rad s−1, strain was held at 500% in grey regions (30s) and 5% in white regions (600s). A magnified view of one high strain interval is shown to demonstrate the strain induced gel-sol transition. For all graphs, filled symbols represent G’, open symbols represent G”. All bars represent the mean ± SD of three independently formed gels for each weight percentage. Significance testing was performed using Tukey’s multiple comparisons test.

