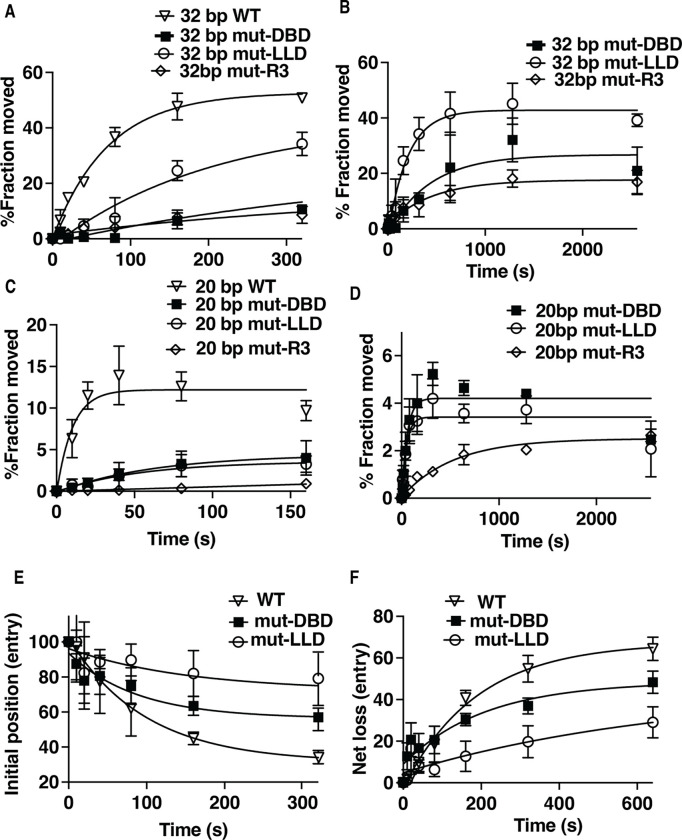
Figure 7. DNA displacement on the entry side is reduced when the LLD patch of Arp5 is mutated.
(A-D) The extent of DNA moves (A-B) 32 bp on the exit and (D-C) 20 bp on the entry side is plotted versus time using a photoreactive probe attached to residue 53 of histone H2B for wild type (open triangle), mutant (mut)-DBD (closed square) and mutant (mut)-LLD (open circle) Arp5 complexes. The same symbols are also used in (E-F). In (C-D) the reactions are monitored for longer times. (E) The rate at which the initial DNA position disappears is shown for wild type and mutant Arp5 as in (A-D). (F) The net loss of DNA crosslinking on the entry side is plotted versus time similar to (A-D). Three replicates are performed for each condition and error bars represent the mean ± SD.

