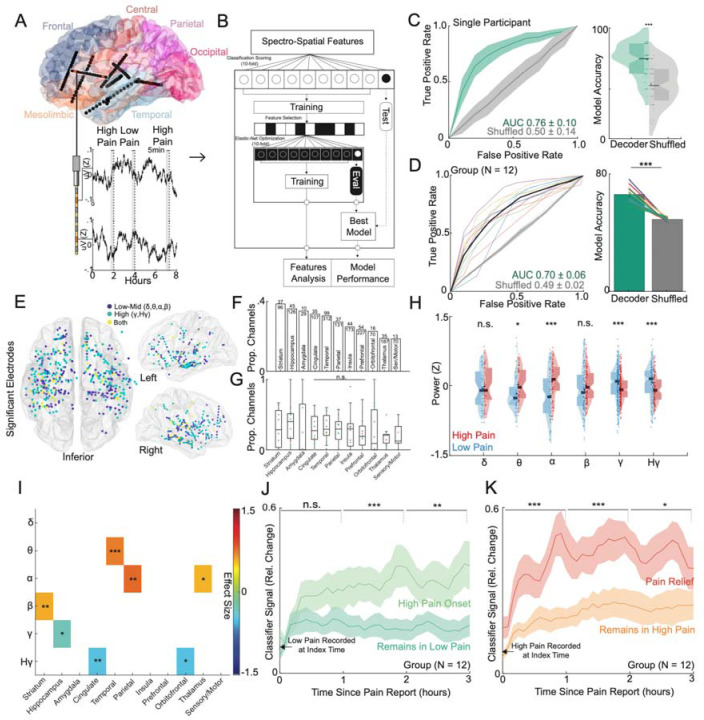
Figure 2: Intracranial neural activity sufficient for decoding of self-reported acute pain states are spatially distributed, temporally stable and modulated by pain onset or pain relief.
A) Location of implanted depth electrodes in an example participant. Traces of raw voltage recording are shown for the two-colored electrodes over an 8-hour period, during which three self-reported pain scores were recorded. Five minutes prior to each pain score are used to construct spectro-spatial features. B) Spectro-spatial features are subsequently used to train an Elastic-Net regularized logistic regression model to classify between low versus high pain states. A nested cross-validation design is used to optimize hyperparameter selection and prevent overfitting. C) Left Panel: Mean receiver operating characteristics (ROC) curve for the same example participant for self-reported pain state classification across cross-validation folds and bootstraps. The grey curve represents the ROC curve when the outcome label is randomly shuffled. The shaded error bar represents the s.e.m across cross-validation folds and bootstraps. Right Panel: Accuracy of the model in prediction of pain states across folds and bootstraps. Accuracy of the model is significantly higher than the shuffled model (two-sample t-test; P<0.001). D) Left Panel: Group ROC curve for prediction of self-reported pain states across 12 participants. The shaded error bar represents the s.e.m across 12 participants. Right Panel: Accuracy of the model in prediction of pain states across 12 participants. Accuracy of the model is significantly higher than the shuffled model (paired t-test: t(11):10.2, P<0.001). E) Significant electrodes across participant classifiers are shown on a common brain in MNI coordinates. Color indicates whether a low to mid frequency (delta, alpha, theta, beta), high-frequency (gamma, high-gamma) or both type of spectral features were used at that location. F) Bar graph showing the sorted proportion of different anatomical regions recruited by classifiers across participants. G) Box plots showing proportion of different anatomical regions recruited stratified by individual participants. Each color dot represents a single participant. No significant difference was observed in the proportion of recruited electrodes across anatomical regions (Chi-square; χ2 = 7.2, P = 0.70). H) Normalized median distributions of low versus high pain state feature values as stratified by power bands. The median values from high pain states were significantly different from low pain states within theta (two-sample t-test; t(86): 2.41, P=0.02), alpha (t(138): 4.81, P<0.001), gamma (t(510): 3.25, P<0.001) and high gamma (t(234): 3.21, P<0.001) power bands. I) Heatmap displaying the power-region feature pairs that demonstrate a consistent effect size between high and low pain states (one-sample t-test; Single asterisk is p<0.05, double asterisk is p<0.01, and triple asterisk is p<0.001; FDR correction for multiple test comparisons). J) Percent change in the index classifier signal overtime when starting in a low pain state and subsequently stratified by if the next pain measurement remains in a low pain state or transitions to a high pain state (pain onset). Greater percent change in classifier signal is observed during pain onset. Shaded error bars represent s.e.m across participants. K) Percent change in the index classifier signal overtime when starting in a high pain state and subsequently stratified by if the next pain measurement remains in a high pain state or transitions to a low pain state (analgesia). Greater percent change in classifier signal is observed during analgesia. Shaded error bars represent s.e.m across participants. Single asterisk is p<0.05, double asterisk is p<0.01, and triple asterisk is p<0.001

