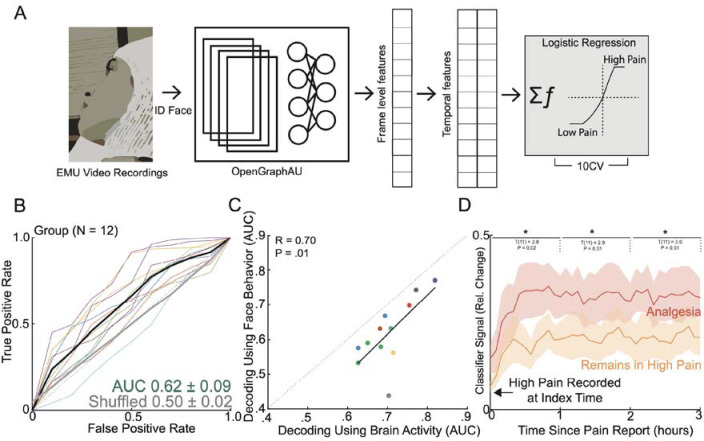
Figure 3: Facial dynamics underlying acute pain states.
A) To evaluate aspects of behavior during high versus low self-reported pain states, we performed automatic quantification of facial muscle activation on a per-video frame basis. To do this, we devised a custom video processing pipeline where faces were first extracted from a frame, then the participant of interest was isolated from staff and family members using facial recognition, and finally the isolated face embeddings were fed into a pre-trained deep learning model to facial action unit (AU). Frame level AU outputs were collapsed across time to generate temporal statistics, which were subsequently used to decode self-reported pain states in a nested cross-validation scheme. B) Group ROC curves for decoding pain states using facial dynamics quantified during the five-minute window prior to pain report, which is the same time window used for electrophysiological pain decoding. Lines represent participants while the shaded gray error bar represents the decoding performance when the outcome label was shuffled. C) Performance of decoding based on facial dynamics is directly correlated with decoding based on brain activity (Pearson’s R: 0.70, P=0.01). Given all the points are on the right of the diagonal, brain decoding outperforms facial behavioral decoding for all participants. D) Percent change in the index classifier signal overtime when starting in a high pain state and subsequently stratified by if the next pain measurement remains in a high pain state or transitions to a low pain state (analgesia). Greater percent change in classifier signal is observed during analgesia. Shaded error bars represent s.e.m across participants. Single asterisk is p<0.05, double asterisk is p<0.01, and triple asterisk is p<0.001

