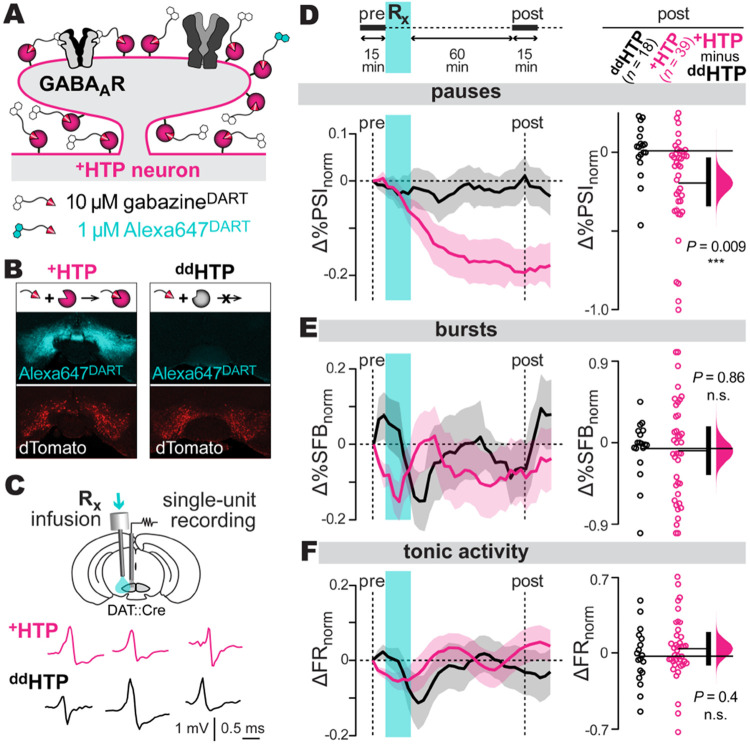
Fig. 1: GABAA receptors mediate VTADA pauses in vivo.
A: DART technology. AAV expression of the +HTP protein (pink) enables cell-specific covalent capture of gabazineDART (black) and Alexa647DART (cyan) ligands. Once tethered, gabazineDART blocks native GABAA receptors, while Alexa647DART enables fluorescent visualization of target engagement.
B: Example histology. AAV expression of the active +HTP or control ddHTP in VTADA neurons is indicated by dTomato (red). All mice receive an intracranial ligand infusion of 10 μM gabazineDART + 1 μM Alexa647DART, and are perfused 36 hr later for histology. Alexa647DART (cyan) quantifies ligand target engagement.
C: Electrophysiology. Top: an electrode bundle targeting the medial VTA enables in vivo extracellular recordings. A nearby cannula permits ligand infusion. Bottom: sample putative dopamine-neuron spikes, recorded in head-fixed animals, shown for +HTP and ddHTP mice.
D: Pauses in firing: Top: time course of recording, baseline 15-min (pre-gabazineDART) followed by infusion and post-gabazineDART recording. Bottom: pause metric, %PSI (percent of interspike intervals longer than twice the median interspike interval). Changes in %PSI compare a 15-min baseline (%PSIpre) to a 15-min sliding window (%PSIpost) according to Δ%PSInorm=(%PSIpost−%PSIpre)/(%PSIpost+%PSIpre). Left: Δ%PSInorm time course, mean ± SEM over cells (n = 18 ddHTP cells, 3 mice; n = 39 +HTP cells, 5 mice). Right: steady-state Δ%PSInorm (1-hr post-gabazineDART) with individual cells (circles), group means (thin horizontal lines), mean-difference bootstrap (pink distribution), and 95% CI of the two-sided permutation test (vertical black bar); +HTP and ddHTP cells differ significantly (P=0.009).
E-F: Burst/tonic firing: Analysis of %SFB (percent of spikes fired in bursts) and FR (firing rate) from the same cells; format as above.

