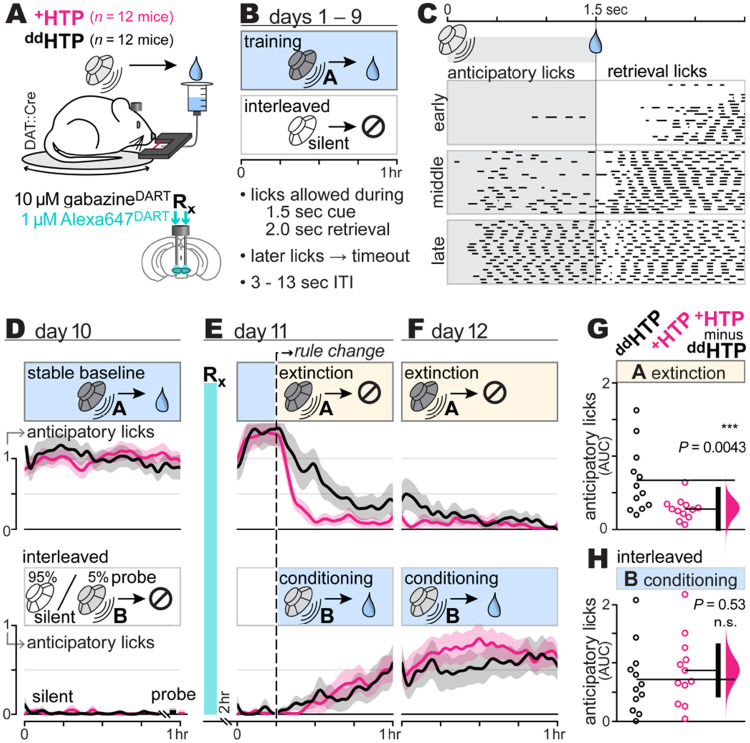
Fig. 2: Blocking GABAA receptors on VTADA cells accelerates Pavlovian extinction.
A: Pavlovian behavior paradigm. DAT::Cre mice with bilateral VTA cannula and +HTP or ddHTP expression in VTADA cells. Mice are head-fixed and presented with auditory cues and sucrose-water rewards. Licks detected with infrared beam; locomotion monitored via circular treadmill.
B: Training regimen. Over 9 days, mice undergo sessions where cue A (2.5 kHz tone, 1.5 sec) reliably signals reward, interspersed with silent trials (no cue, no reward) to monitor nonspecific licking. Licking during the random (3-13 sec) inter-trial interval is discouraged with a timeout, training mice to ignore environmental sounds other than cue A. Each session lasts 1 hour and comprises 100-150 cue A trials.
C: Anticipatory licking. Black line segments show beam breaks (licking) from a sample mouse on days 1 (early), 2 (middle), and 9 (late) of training.
D: Stable baseline. To account for individual-mouse differences, day 10 anticipatory licking to cue A is calculated for each mouse and used as a constant of normalization for that animal. The same normalization constant is applied to cue A trials (top) and silent / cue B trials (bottom). Lines and shading are the normalized anticipatory licking mean ± SEM over mice (n = 12 ddHTP mice; n = 12 +HTP mice).
E-F: Pavlovian learning. On day 11, mice receive gabazineDART and a 2 hr rest. The first ~15 min of the assay continue the prior day’s rules. Following the rule change, unrewarded cue A trials (extinction) are randomly interleaved with rewarded cue B trials (conditioning), contingencies which continue into day 12. Lines and shading are licknorm mean ± SEM over mice (n = 12 ddHTP mice; n = 12 +HTP mice).
G: Extinction AUC (area under the curve; licksnorm × hr), integrating licknorm over 1.75 hr (post rule-change). AUC = 1.75 indicates no extinction (cue A anticipatory licking equal to that on day 10), while smaller values indicate greater extinction. AUC of individual mice (circles), group means (thin horizontal lines), mean-difference bootstrap (pink distribution), and 95% CI of the two-sided permutation test (vertical black bar) indicate a significant difference between +HTP and ddHTP mice (P=0.0043).
H: Conditioning AUC. Format as above, showing cue B conditioning trials from the same mice (P=0.53).

